ES short term trading 5-07-10
Once again a historic day. (the secular bear that started in 2000 has seen many of them!).Unlike 87,(i was trading!), unlike 98, unlike all the history made last year in a historic bear market, this crash was simply stunning. The dow plunged 1000 points not in time measured in 2 days or even all day, but in MINUTES! Welcome to the new dayz of algorithm driven robot trading! TRULY AMAZING . I didnt have many comment or posts during most of it because my charts were messing up (so i thought) and ive been around enough to know when Not to trade. I thought that was pretty much common sense, but apparently some chose otherwise. Foolish! I saw movements measured not in 1 or 2 handle increments like the 87 crash, but moves that looked like 7 or 8 handles at a time.I read one analyst who said they were closer to 20.Anyway, to the future. Like with any major earthquake, there is always the chance of small aftershocks, so please if you decide to dip your toe in the water, exercise due caution and USE PROTECTIVE STOPS!....Trust me, new highs (thats right i said new rally highs are ahead). The world isnt ending quite yet! lol
Originally posted by koolblue
yippee! out at the red avg 1117.25 on both.. nice and quick .. just da way i likes it!
nice one Koolblue!

THX FRIEND. well bulls really need to break it above these avgs here.. 18.50 to 1121 and change. And tech indicators say its possible ...watching
zzzzzzzz. still at the avg's!
Originally posted by johnpr2010
Originally posted by MonkeyMeat
Originally posted by MonkeyMeat
Originally posted by johnpr2010
I see a short area @1115.75
I see dead people.
What is it that you're seeing, analysis-wise, for a short in that area?
Hey this is for the one that talked tooo much. What the market did? Dont give me minus feedback if you dont know what I am talking. Thanks
Hey John ... (fyi, I didn't vote you down) ... the "I see dead people" quote was from the movie; just offering levity. But my question was legitimate. Thanks for following up when Phileo subsequently inquired
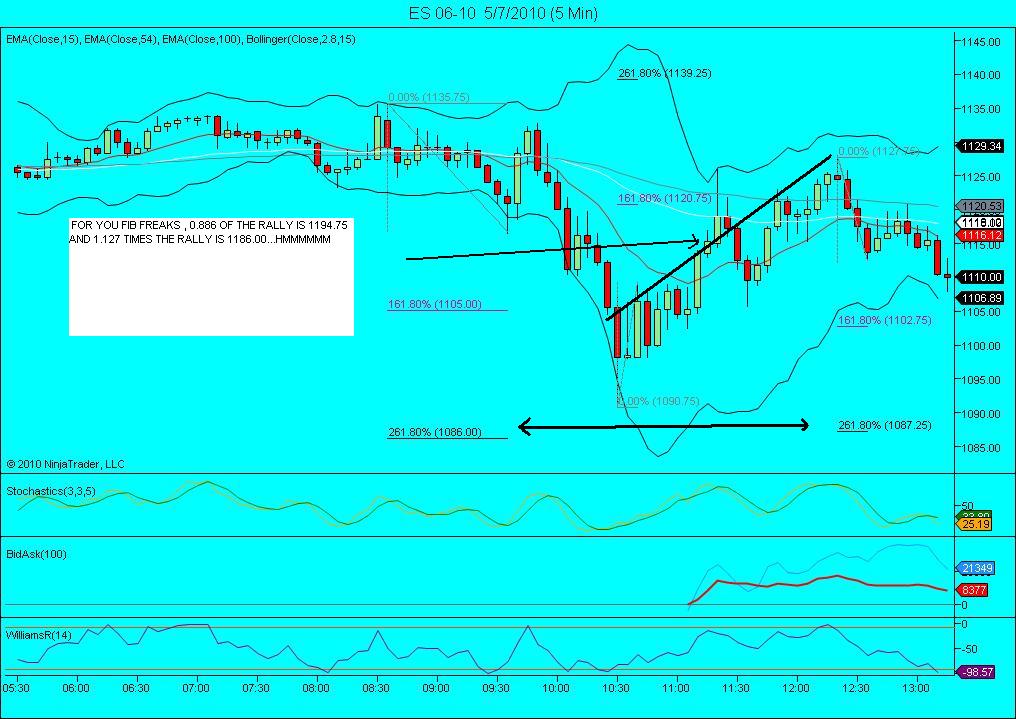
This dont look good! IF 1105 doesnt hold last hope for bulls is 1102.75. But , we'll see,
Click image for original size
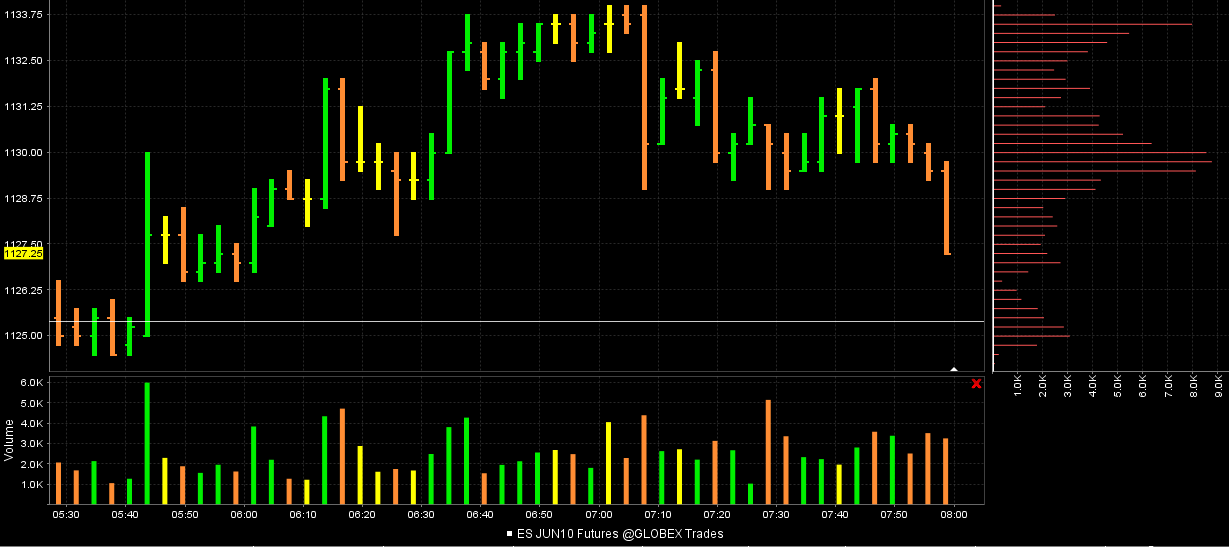
Sorry for the delay Paul....I don't really use Triples in the overnight but the 26.25 had a "Missing tooth" in the volume...here is the screen shot I just happened to grab in the hopes that someone would be wondering why I thought that 26.25 number would fill in...from up at 1132....noticed the low area on the price histogram on the right....
What also helped is that 1125 ( key numbers 00,25,50 and 75) and at that time the overnight midpoint was down there....For me the trade starts with a target and then I'm busy trying to trade for that target....I hope this chart helps
What also helped is that 1125 ( key numbers 00,25,50 and 75) and at that time the overnight midpoint was down there....For me the trade starts with a target and then I'm busy trying to trade for that target....I hope this chart helps
Originally posted by PAUL9
Bruce,
trips at 1124.75, is that your 1125 number?
FWIW, gapguy filtered for days following 2.5% or larger close to close loss, 85% of them close opening gap by end of day. Yest close was 1122.75.
also, Najarian on cnbc explained that since the Nasdaq busted so many trades, net effect is some people short: bought at ridiculously Low prices, later sold to book long sided profits, but had initial purchase wiped out, so net short, have to cover.
Click image for original size
symetric profile today and stuck inside hour range....I would not be surprised to see them test back up into 1115 -1117....
The real problem is that it's friday and sometimes these symetric patterns like to close on extreme highs or lows..the other challenge is that we have peak volume from O/N and the day session ABOVE the current swing low at 1107.50...so caution is needed
I point it out for conceptual concept value..
Coolest thing today was how the peak volume in the overnight ( 30 - 33) held back the initial rally..
seems like lots of stops below 98 and 98.25 so if down is the way to go that will be targeted..I have nothing working because of these conflicts...if they run out the 98's first then I may look long
thanks for the chart..have a great weekend
Emini Day Trading /
Daily Notes /
Forecast /
Economic Events /
Search /
Terms and Conditions /
Disclaimer /
Books /
Online Books /
Site Map /
Contact /
Privacy Policy /
Links /
About /
Day Trading Forum /
Investment Calculators /
Pivot Point Calculator /
Market Profile Generator /
Fibonacci Calculator /
Mailing List /
Advertise Here /
Articles /
Financial Terms /
Brokers /
Software /
Holidays /
Stock Split Calendar /
Mortgage Calculator /
Donate
Copyright © 2004-2023, MyPivots. All rights reserved.
Copyright © 2004-2023, MyPivots. All rights reserved.