ES Short Term Trading 5-11-10
Here's the Price Action Support Resistance levels that I see. With the way the market has acted with all the volatility, they're spaced relatively wide apart ... and should be, as always, taken as "zones" give or take a point or two in this market.
Here's the 30m chart with S/R lines in Red and the Cyan dashed lines are the Wkly pivot prices ... Magenta line is semi-significant. Hope this is a helpful map.
Here's the 30m chart with S/R lines in Red and the Cyan dashed lines are the Wkly pivot prices ... Magenta line is semi-significant. Hope this is a helpful map.
Click image for original size
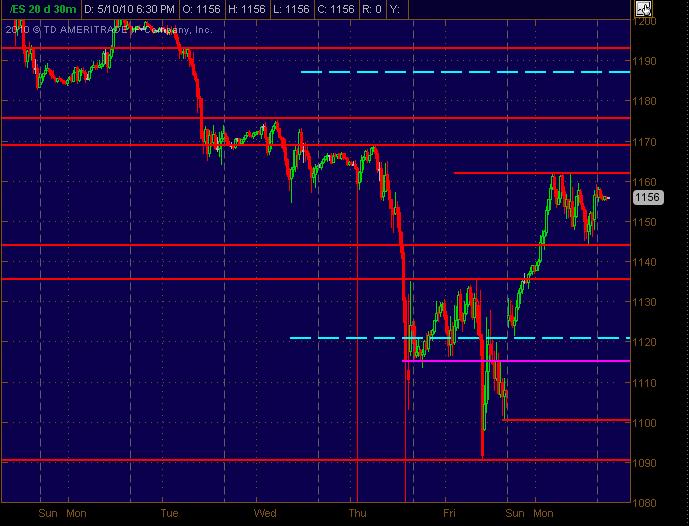
Btw, others have posted with good rationale and analysis, nailing price levels. I think some good Market Profile interpretation has been the best at describing what the market is and wants to do lately. Thanks to Bruce, Phileo, Kool and others that share some good price numbers backed by rationale (an education) where I'm always learning and combining with my own stuff. The most significant areas from my analysis are these (funky overnight can always change a monkey level and twist his mind):
1187 ... is Wkly R1 and Daily R2
1176 ... signif price action Resistance level
1160-62 ... triple high swings on 5/10 intraday zone
1144-46 ... price action Support and Daily Mid Pivot
If I get a chance, I'll post some other next-level-down potential price action S/R zones. Looking forward to all of y'all's analysis and chart postings coming into Tuesday's trading!
(my Thinkorswim daily pivots indicator, mypivots numbers, and a couple of other sites are all showing variations on the Pivot Levels fwiw ... thinking it may be due to the funky price action lately)
well done friend! I voted you up!
monkeymeat....good stuff. i voted you up as well.
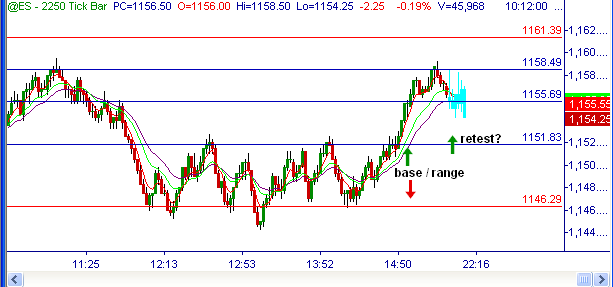
a note worthy "zone" is 46-52.....if we continue up....my guess is it would be from here. Possibly at the end of day we had a break out of the base (not completely b/c of channel), however, my GUESS is if we want to go up, it might retest it then leave from there.
If that so called zone fails then that gap below is a HUGE magnet to just run through.
So the true channel or base is that whole section, 43-61...at least on a larger time frame.
here is a small time frame chart on the 46-52 base. Globex is in blue.
Click image for original size
New here. I appreciate all the knowledge you guys have it's really helping me with my analysis. How you blend everything. I'm doing well with my entries, however, once I enter I'm having trouble managing my stops and taking profit. Do you guys trail your stops when your scalping? Bring them to entry after x amount given the range your looking at? What's the main thing you guys use to indicate the trade is going to reverse or isn't moving accordingly? Any help would be greatly appreciated.
Here's my homework for tomorrow:
Notes:
- I think the weekly pivot (1121) as highlighted in MonkeyMeat's S/R map is an important area for this week. It was tagged in Sunday's overnight session, but not in RTH.
- I believe 1177 (also highlighted as 1176 in MM's earlier post) is an important bull/bear resistance area; a sustained move above that could be looked upon as one big massive hammer reversal.
- Aside from today's triple touch resistance, I don't see anything else special about 1160-1162 (perhaps others can contribute something significant about this area). Nonetheless, it should be good for at least a 2pt short on first time touch.
- I agree with TraderF's assessment: 1146 (1144 in my analysis) needs to hold in order for any market rally to take place.
- The 2 cyan lines i have highlighted are:
- 1115: this was a hidden reaction area and also the centre of congestion from Friday. (see KoolBlue's chart from the weekend preview)
- 1107: gap fill support. We really don't want to see price stay below this for long
- we are still in a series of lower highs and lower lows, and today's massive gap up, impressive as it looks, hasn't really changed the structure of the downtrend. Price is below the 10, 20, and 50d EMA, and they are pointing down still, suggesting that sellers are in control.
- I have perused the leadership stocks (GS, AAPL, GOOG, BAC, IBM, AMZN), and none of them look bullish to me. Ditto for the various sectors that I monitor.
If there are no major market moving news events announced tomorrow, I will be looking for a failed breakout in the 1162-1166 area to kick off a back-and-fill campaign to fill the gap (may take a few days, so definitely bearish if done in one day). I do hope market participants do step in and front run the gap fill attempt, but would not be surprised to see the price even dip below 1107 before reversing.
Click image for original size
Notes:
- I think the weekly pivot (1121) as highlighted in MonkeyMeat's S/R map is an important area for this week. It was tagged in Sunday's overnight session, but not in RTH.
- I believe 1177 (also highlighted as 1176 in MM's earlier post) is an important bull/bear resistance area; a sustained move above that could be looked upon as one big massive hammer reversal.
- Aside from today's triple touch resistance, I don't see anything else special about 1160-1162 (perhaps others can contribute something significant about this area). Nonetheless, it should be good for at least a 2pt short on first time touch.
- I agree with TraderF's assessment: 1146 (1144 in my analysis) needs to hold in order for any market rally to take place.
- The 2 cyan lines i have highlighted are:
- 1115: this was a hidden reaction area and also the centre of congestion from Friday. (see KoolBlue's chart from the weekend preview)
- 1107: gap fill support. We really don't want to see price stay below this for long
- we are still in a series of lower highs and lower lows, and today's massive gap up, impressive as it looks, hasn't really changed the structure of the downtrend. Price is below the 10, 20, and 50d EMA, and they are pointing down still, suggesting that sellers are in control.
- I have perused the leadership stocks (GS, AAPL, GOOG, BAC, IBM, AMZN), and none of them look bullish to me. Ditto for the various sectors that I monitor.
If there are no major market moving news events announced tomorrow, I will be looking for a failed breakout in the 1162-1166 area to kick off a back-and-fill campaign to fill the gap (may take a few days, so definitely bearish if done in one day). I do hope market participants do step in and front run the gap fill attempt, but would not be surprised to see the price even dip below 1107 before reversing.
These numbers are from Yesterday but still apply today. Monday produced another neutral day as per volume and the market was only able to extend outside the first hours range for only brief moments.
This implies to me that bigger traders just weren't interested in buying or selling. I was surprised that the 41 number didn't get traded to yesterday but I see they cleaned that up in the O/N session.
1170 ***
1158 - 1160 current O/N high, old volume number, near RTH highs
1151 - Little trade here in the O/N session....what is interesting about this number is that little trade took place here on the UPSIDE on Sunday night and now little trade has taken place here in the O/N on the downside. We saw this same concept with our old friend the 94 - 96 last week or before.
47.50 - Lots of tests of this in RTH and O/N building volume here..
Will be watching this and that amazing 10650- 670 on the YM,,If we can get above these in the RTH session and hold above then we will go fill in the 51 number and much higher..this will get tested from below I think in O/N or rth!!!
41.50 - the one that alluded us yesterday and is testing now in O/N session
35.50 a high Volume from Sunday ON
These seems to gel well with what you folks already posted
30 - also a HV from Sunday
I think it's interesting how we failed yesterday at trading back to the Sunday O/N midpoint but then traded back to that midpoint in Mondays O/N session....
In other words when we fail at an O/N midpoint it seems to trade back to it soon after...not rocket science since most of the time we back and fill anyway..
That 41 ( Midpoint from Sunday)is also the Weekly S1 level so we have other forces at work there...
They are testing the 47 area from below and I missed that trade...here in O/N...Damn..would have been a good start
48 is current O/N midpoint....FWIW..
I don't scalp so can't comment on that....The short answer to your question is really just another signal....
As an example..If I'm short and we get a down air pocket then there is a good chance I will take more off the postion as I don't want to go through the back and fill process...
Yesterday I thought I had a great short but then noticed that very little trade took place at 57.50 I think.....so I exited except for two runners and was hoping that 57.50 wouldn't get traded back to...well it did and my runners got stopped out...
I'm a bit slow and a better trader would stop and reverse but my brain doesn't process that well
In general I think it extremely difficult to manage trades and having a limited number of contracts on makes it even harder because we are afraid to miss the move...sorry I can't be more help but for me it's highly discretionary except for the fact that I always have targets in mind when I put the trade on...places where I think the market should test or "fill in"
Originally posted by cm19
New here. I appreciate all the knowledge you guys have it's really helping me with my analysis. How you blend everything. I'm doing well with my entries, however, once I enter I'm having trouble managing my stops and taking profit. Do you guys trail your stops when your scalping? Bring them to entry after x amount given the range your looking at? What's the main thing you guys use to indicate the trade is going to reverse or isn't moving accordingly? Any help would be greatly appreciated.
Bruce,
your comment about trading back to the midpoint of the AH (Overnight) of the preceeding day was one of the rudimentary observations I had made weeks ago when I was trying to figure out how in the world to use AH PA, is it predictive?
The charts I showed (AH PA Only, included the 50% retracement level of the >>> previous day's AH activity). my general assumption at the time was that all other things being equal (which they never are!), if 50% of the previous day's AH range acts as support, higher probability for a move to take out current AH H (if 50% of prior day's AH range acts as resistance, higher prob of taking out AH L).
Think about it.
Markets constantly look for re-assurance by retracing moves; in that retracement, the chart pivot point (not floor trader pivots, I'm talking about a swing price point, a swing H or swing L) tells you what price is making buyers or sellers salivate. In order for prices to move, buyers have to more aggressiveness than sellers, or vice versa.
A pure 50% rettracement of the RTH can also have importance.
just a sidenote, my study of the AH PA was inspired by a Steenbarger observation,
I was reading a Steenbarger comment regarding overnight Highs and Lows, he said that 90% of the time, the overnight H or L is taken out in the RTH. (O/N = overnight, same as AH = After Hours) 90% is a huge number, but when you consider that the 90% refers to taking out either the AH High -OR- the AH Low, is there anyway to tilt the odds as to which one...
50% retracements are a big deal. Dobson, the owner of Traders Press, wrote a book called, "The Trading Rule That Can Make You Rich." All the book did was document many charts where 50% retracements of big moves proved to be worth a shot at a position.
Originally posted by redsixspeed
Originally posted by feng456
followed my plan to the letter
==================================================================
Hey feng;
Record your trade from time to time. Call the trade as you
see it setting up, record what you say then go back later
listen to what you did right. This may be a good teacher...
You might also want to record what you're up to in the Trading Journals section of the site. Create a new topic for yourself and post what you're up to and when you didn't follow your plan.
Emini Day Trading /
Daily Notes /
Forecast /
Economic Events /
Search /
Terms and Conditions /
Disclaimer /
Books /
Online Books /
Site Map /
Contact /
Privacy Policy /
Links /
About /
Day Trading Forum /
Investment Calculators /
Pivot Point Calculator /
Market Profile Generator /
Fibonacci Calculator /
Mailing List /
Advertise Here /
Articles /
Financial Terms /
Brokers /
Software /
Holidays /
Stock Split Calendar /
Mortgage Calculator /
Donate
Copyright © 2004-2023, MyPivots. All rights reserved.
Copyright © 2004-2023, MyPivots. All rights reserved.