ES Short Term Trading 5-11-10
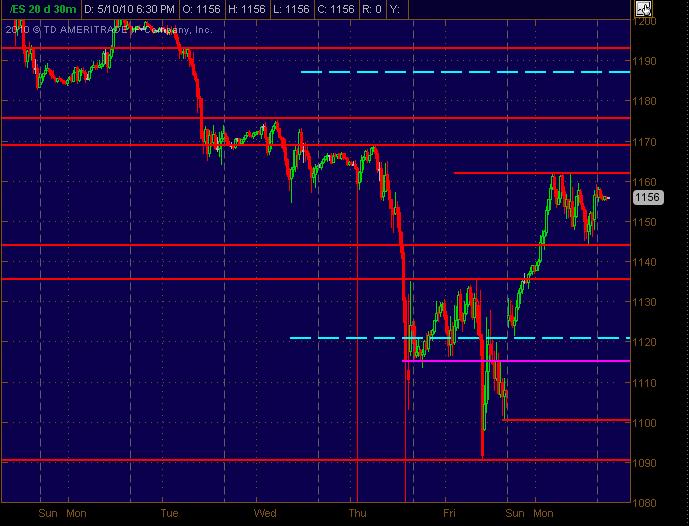
Here's the Price Action Support Resistance levels that I see. With the way the market has acted with all the volatility, they're spaced relatively wide apart ... and should be, as always, taken as "zones" give or take a point or two in this market.
Here's the 30m chart with S/R lines in Red and the Cyan dashed lines are the Wkly pivot prices ... Magenta line is semi-significant. Hope this is a helpful map.
Here's the 30m chart with S/R lines in Red and the Cyan dashed lines are the Wkly pivot prices ... Magenta line is semi-significant. Hope this is a helpful map.
Click image for original size
I believe in a day or 2 it will become evident the top ive been looking for the 10th-11th may be in, but juries still out right now (i would have felt better if 74-75 or 1183 got hit!).. see ya tomorrow!
Originally posted by BruceM
and nice call KOOL...or should I call u Eagle eye???
That was a good fade Phileo...didn't want you to think I didn't notice...ballsy but very cool!!
thx.
I was hoping 1156-57 would be a reversal area, but it turned out to be more of a battleground between the buyers and sellers, and the buyers lost..... for now.
It was swinging up and down quite a bit, so I knew i needed to get out.
62-64 and 51 - 53 are keys heading into O/N...
there is one spot that didn't overlap today and that was the 46.50.....we'll see what the O/N brings
Bruce,
Do you strictly use Market Profile? The O/N numbers you just posted do you ascertain that just by looking at the volume bars? Can you post a chart of what you are referring to?
Do you strictly use Market Profile? The O/N numbers you just posted do you ascertain that just by looking at the volume bars? Can you post a chart of what you are referring to?
Originally posted by BruceM
there is one spot that didn't overlap today and that was the 46.50.....we'll see what the O/N brings
I look at high and low volume bars and the price histogram for most numbers...I am evolving and seem to gravitate more towards a volume profile.
High and low volume are attractors .....see the price overlap thread....If you look at a one minute from todays RTh you will see that at 46.50 noprice oevrlapped that...
42 - 41 was/is key because it was O/N low...
the specific numbers I mentioned where based on peak volume from tuesdays RTh session///let me know if I have answered or helped...I'll try harder
Thank you. You have been very helpful. This is still a work in progress for me so I really appreciate your input.
Originally posted by BruceM
I look at high and low volume bars and the price histogram for most numbers...I am evolving and seem to gravitate more towards a volume profile.
High and low volume are attractors .....see the price overlap thread....If you look at a one minute from todays RTh you will see that at 46.50 noprice oevrlapped that...
42 - 41 was/is key because it was O/N low...
the specific numbers I mentioned where based on peak volume from tuesdays RTh session///let me know if I have answered or helped...I'll try harder
Originally posted by feng456
followed my plan to the letter
==================================================================
Hey feng;
Record your trade from time to time. Call the trade as you
see it setting up, record what you say then go back later
listen to what you did right. This may be a good teacher...
Originally posted by redsixspeed
Originally posted by feng456
followed my plan to the letter
==================================================================
Hey feng;
Record your trade from time to time. Call the trade as you
see it setting up, record what you say then go back later
listen to what you did right. This may be a good teacher...
You might also want to record what you're up to in the Trading Journals section of the site. Create a new topic for yourself and post what you're up to and when you didn't follow your plan.
Emini Day Trading /
Daily Notes /
Forecast /
Economic Events /
Search /
Terms and Conditions /
Disclaimer /
Books /
Online Books /
Site Map /
Contact /
Privacy Policy /
Links /
About /
Day Trading Forum /
Investment Calculators /
Pivot Point Calculator /
Market Profile Generator /
Fibonacci Calculator /
Mailing List /
Advertise Here /
Articles /
Financial Terms /
Brokers /
Software /
Holidays /
Stock Split Calendar /
Mortgage Calculator /
Donate
Copyright © 2004-2023, MyPivots. All rights reserved.
Copyright © 2004-2023, MyPivots. All rights reserved.