ES Short Term Trading 5-12-10
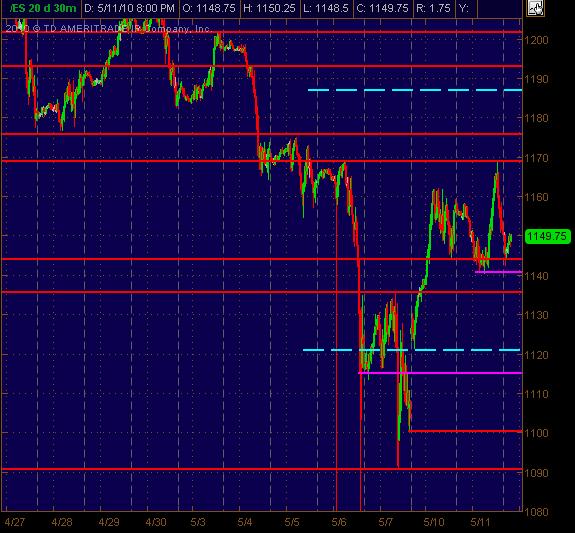
1140-1142 area seems like it needs to hold for longs (even w/a quick small flush, stop run) … if it breaks and holds, further pushes down to next Support levels are a high probability, especially if overnight trading doesn’t rally much from the RTH close … Daily S1 is also at 1139
1160-1162 is initial likely resistance if price moves up … and it seems that we’re in a choppy or range swing of prices right now
1170 is possible but don’t see it quite getting there or exceeding it … this is based on how price trended up Tuesday and then retraced so much of the move.
I’m biased long looking at the charts and some stock charts ... from 1140 to and up thru 1150
Tossing out both a 30min S/R chart along with a 5min chart to drill down to more micro-S/R areas
Hope this is helpful as a map for the day (barring another weird giant news event which seems to be the typical gig lately)
Click image for original size
ok, there's your air fill AND a prc buy...long one only at 1167.00
Click image for original size
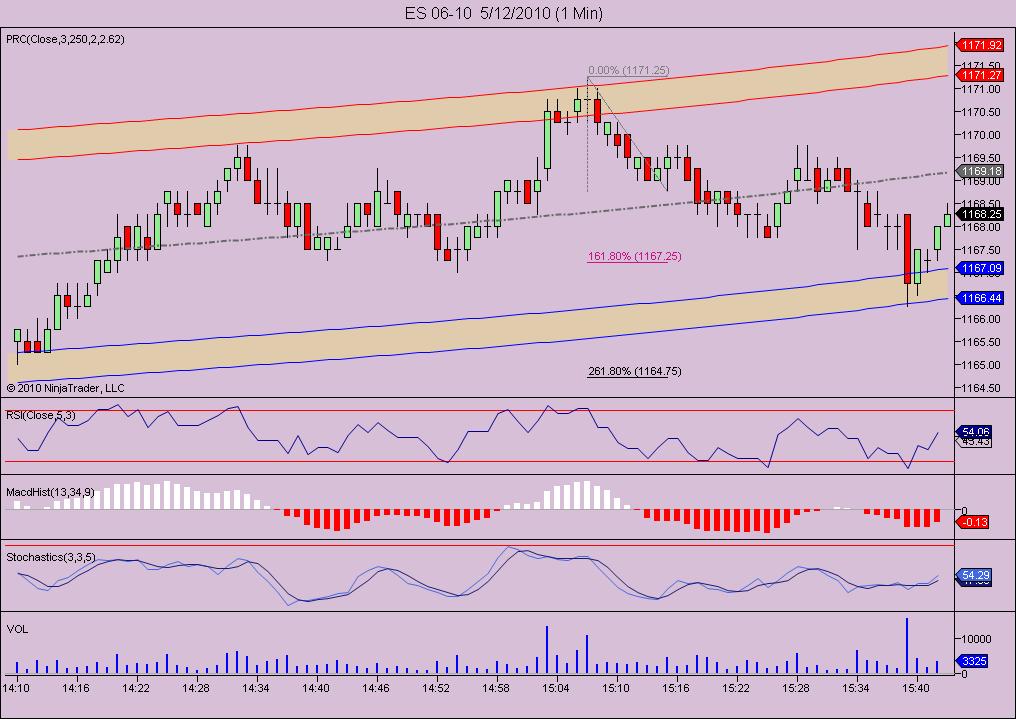
should go to the median line at 69.00 trying for a 68.50 exit
out at 1168.50 and the is your69!... im beginning to wonder how this system would do on the 5 min chart instead of the one min? Up close to 10 handles today!
glad they gotthe 66.75 as that was Modified air but I was greedy and wanted that 63......
63 - 65 needs to go on the radar for the O/N.....not 100% today so hope to be up to speed tomorrow..
Trading is hard work.....somedays!!
Good trading Kool..
63 - 65 needs to go on the radar for the O/N.....not 100% today so hope to be up to speed tomorrow..
Trading is hard work.....somedays!!
Good trading Kool..
It sure is Bruce!.. see everyone tomorrow... 1183.25-1185 is still a possibility with a pause around 73, or more likely 1176.25 first. Next critical day is Friday the 14th!
Kool
What are those brown bands and what are you doing differently today?
What are those brown bands and what are you doing differently today?
I'm using a form of linear regression tied to a moving average so that is constantly updates with every tick. Im using it in conjunction with Kools tools projections and a 5 period RSI. When those 3 conditions are met (hits the band or penetrates it, near or at a kools tools price projection and 5 period rsi at or exceeding the red boundaries, then enact a buy .. or sell. I'm still experimenting, but if it keeps working (under all conditions.. up day , down day, trend days,etc) i'll make it available to whoever is interested.
Kool
I am always interested in your stuff. How can I see the settings?
I am always interested in your stuff. How can I see the settings?
hard to believe today with such lower volume than yesterday...look at those 3 hour closes at 63.25 - 63.50....I'm gonna get them!!!
&^%$, insert favorite explitive here....Curse you red baron...!!!
&^%$, insert favorite explitive here....Curse you red baron...!!!
Click image for original size
Emini Day Trading /
Daily Notes /
Forecast /
Economic Events /
Search /
Terms and Conditions /
Disclaimer /
Books /
Online Books /
Site Map /
Contact /
Privacy Policy /
Links /
About /
Day Trading Forum /
Investment Calculators /
Pivot Point Calculator /
Market Profile Generator /
Fibonacci Calculator /
Mailing List /
Advertise Here /
Articles /
Financial Terms /
Brokers /
Software /
Holidays /
Stock Split Calendar /
Mortgage Calculator /
Donate
Copyright © 2004-2023, MyPivots. All rights reserved.
Copyright © 2004-2023, MyPivots. All rights reserved.