MP CHART week ending 5-14
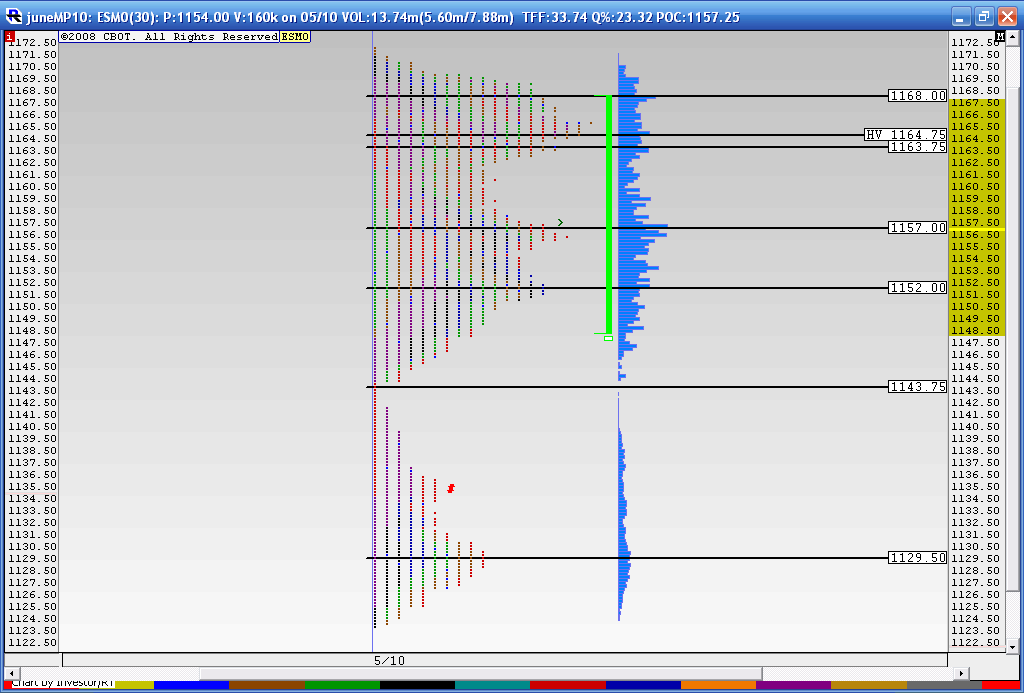
Here is what Last weeks MP chart looked like with the appropriate levels marked...of most interest to me is that air pocket at the 43 .75 area...
Click image for original size
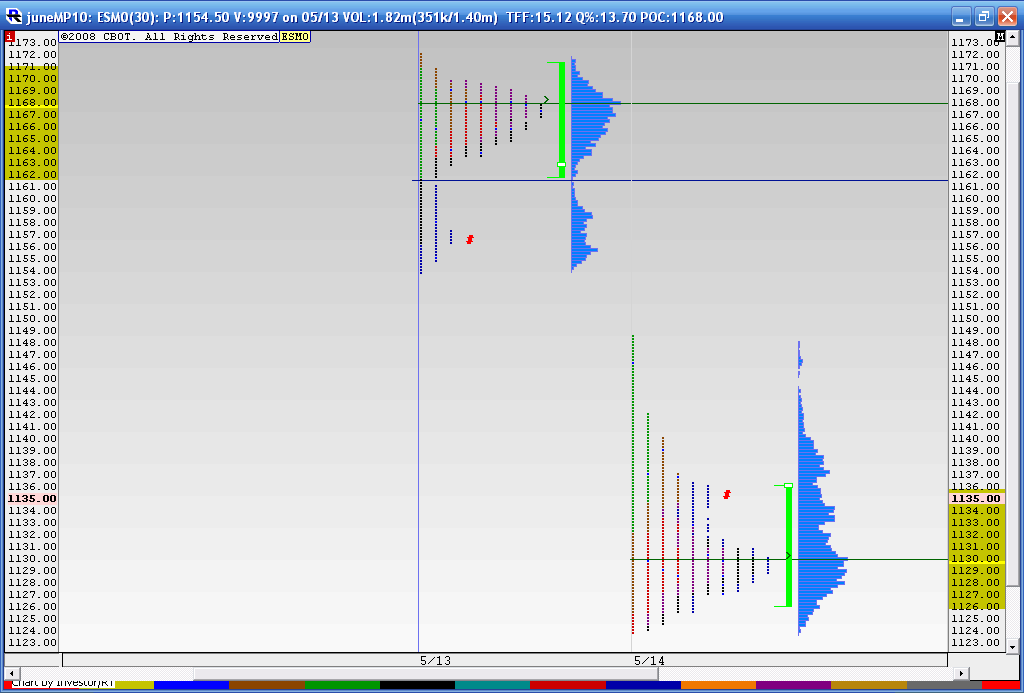
Here is Thursday and friday seperately....technically speaking we have "Air" between todays highs and thursdays low.....Note the "P" pattern at the top and "b" pattern today...
Click image for original size
And lastly here is the combined look of Thurs and Fri....two boobs with the cleavage in the middle....it would be odd if they don't try to fill in some of that space in between...but most think the market is crumbling again...perhaps it is...I don't think so..
Click image for original size
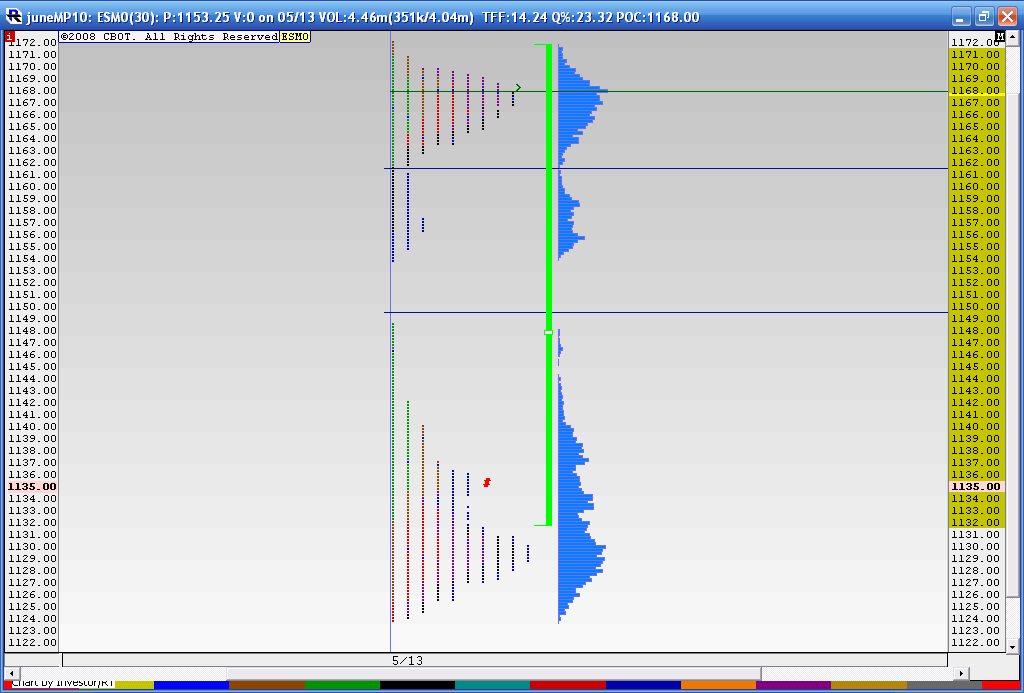
I'm with you Bruce. I think the market will bounce after accumulating that large bearish volume last Friday. I believe it will fill that "cleavage" and even revisit that top boob.
Bruce, thanks for MP charts
yeah, fill the cleavage at some time during the week, I agree
this is OpEx week... major adverse excursions can unfold M-T-W, one day one way, next day a little hangover of the previous day's move and then a reversal so option writers can close out written contracts, to closeout and bank the premiums received (or more realistically writers will be happy to close out positions at pennies on the premium charged when the position were opened).
It is very common to see swings in price in the first 3 days of the week because as price moves in one direction, loser options deflate dramatically in price. If I sold you calls (with a hefty volatility premium) last week, and price drops hard on Monday, I'm more than happy to scoop up the virtually worthless call options I sold and close out the position...
Gap unfilled to 1107.50
Chart support 1110-1100
right on so far Paul......with your option swings
Emini Day Trading /
Daily Notes /
Forecast /
Economic Events /
Search /
Terms and Conditions /
Disclaimer /
Books /
Online Books /
Site Map /
Contact /
Privacy Policy /
Links /
About /
Day Trading Forum /
Investment Calculators /
Pivot Point Calculator /
Market Profile Generator /
Fibonacci Calculator /
Mailing List /
Advertise Here /
Articles /
Financial Terms /
Brokers /
Software /
Holidays /
Stock Split Calendar /
Mortgage Calculator /
Donate
Copyright © 2004-2023, MyPivots. All rights reserved.
Copyright © 2004-2023, MyPivots. All rights reserved.