ES short term trading weekend preview 5-16-10
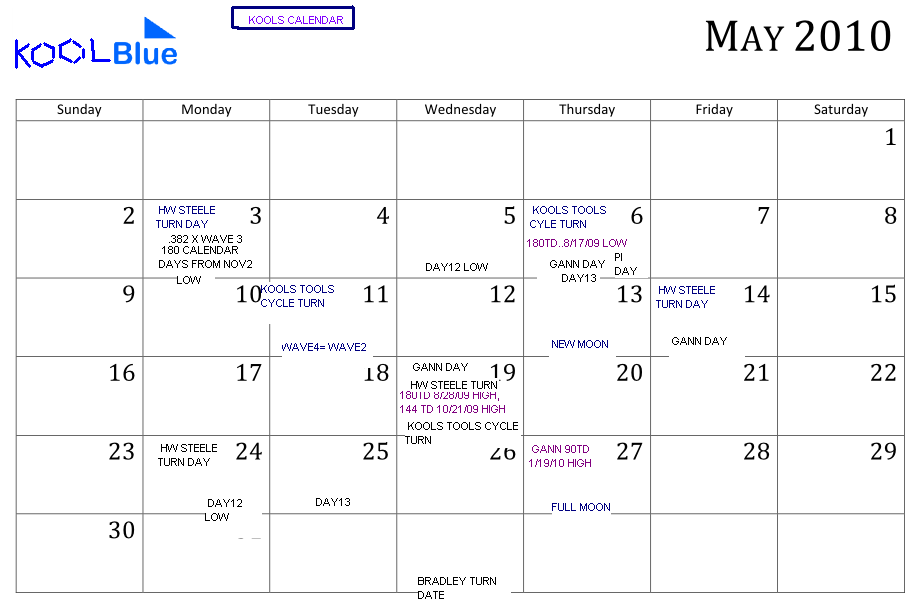
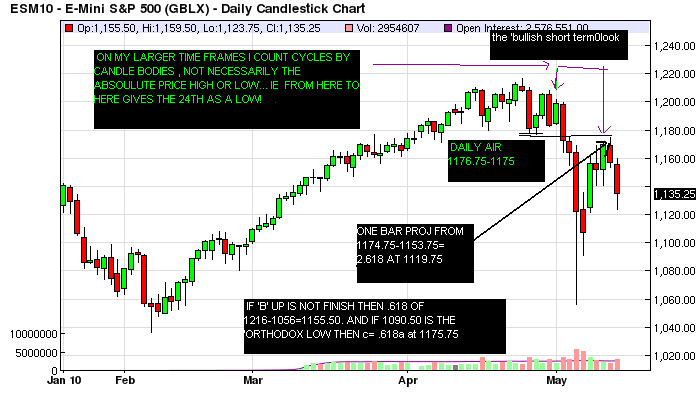
After a nice rally to the minimum 1173-1184 zone, we started a nice 51 handle decline.Im of the bias that the price low (1056) is in but the 'decline' end in terms of time may not be over yet. Either way , since indicators show a high probability of new rally highs over 1216, i'm of the opinion that a supreme buying opportunity is in the making....Some info to ponder: CYCLES.. Last weekend i showed a cycle map that shows basically Mon up then down into the 19th, up again and a final low the 24th. This eerily lines up well with Kools calendar on dates to watch. STATISCALLY.... Mon is of course usually up as is friday expiration day.New highs friday=20, new lows=22 , not what you want on a sustained rally. AVG 5 day range =31.25 and fridays=35.75
AND DA NUMBERS:... 1181.50 Demark wk high; 1161.75-1159.50= major air; 1156 min 2.618 (secondary low); 1151.50 Demark wk pivot; 1152=2.618 5 min from 1123.75; 1147.50 Demark daily high; 1144.00=100ema 13 min; 1144-1142 air 5 and 13 min ; 1143.75=1.618 5 min; 1143.25=.382of 1174.75-1123.75; 1141.50=1.618 13 min;1141.32=.382of 1169.75-1123.75; 1141.62= one half fridays range; 1131= mov avgs currently 5 and 13 min; 1128.50= Demark wk low; 1125.75 one min down if 1136 not breached; 1119.25-1119.75= 4.236 one min and the original 2 hour proj down from 1174.75;1111.75 Demark daily low and proj 2 hour chart; 1101.50-1104= line in the sand for bulls!
Click image for original size
Click image for original size
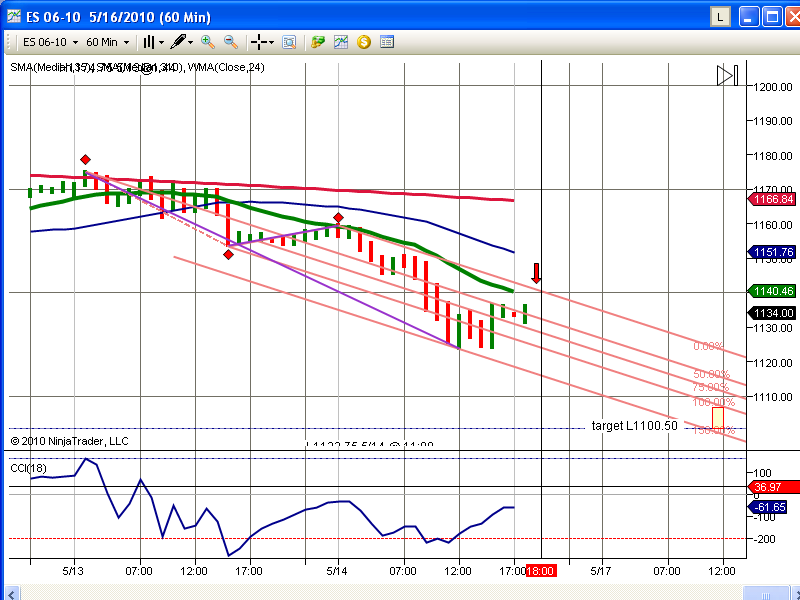
Downside target for Monday 1105.50
Click image for original size
Emini Day Trading /
Daily Notes /
Forecast /
Economic Events /
Search /
Terms and Conditions /
Disclaimer /
Books /
Online Books /
Site Map /
Contact /
Privacy Policy /
Links /
About /
Day Trading Forum /
Investment Calculators /
Pivot Point Calculator /
Market Profile Generator /
Fibonacci Calculator /
Mailing List /
Advertise Here /
Articles /
Financial Terms /
Brokers /
Software /
Holidays /
Stock Split Calendar /
Mortgage Calculator /
Donate
Copyright © 2004-2023, MyPivots. All rights reserved.
Copyright © 2004-2023, MyPivots. All rights reserved.