ES short term trading 5-17-10
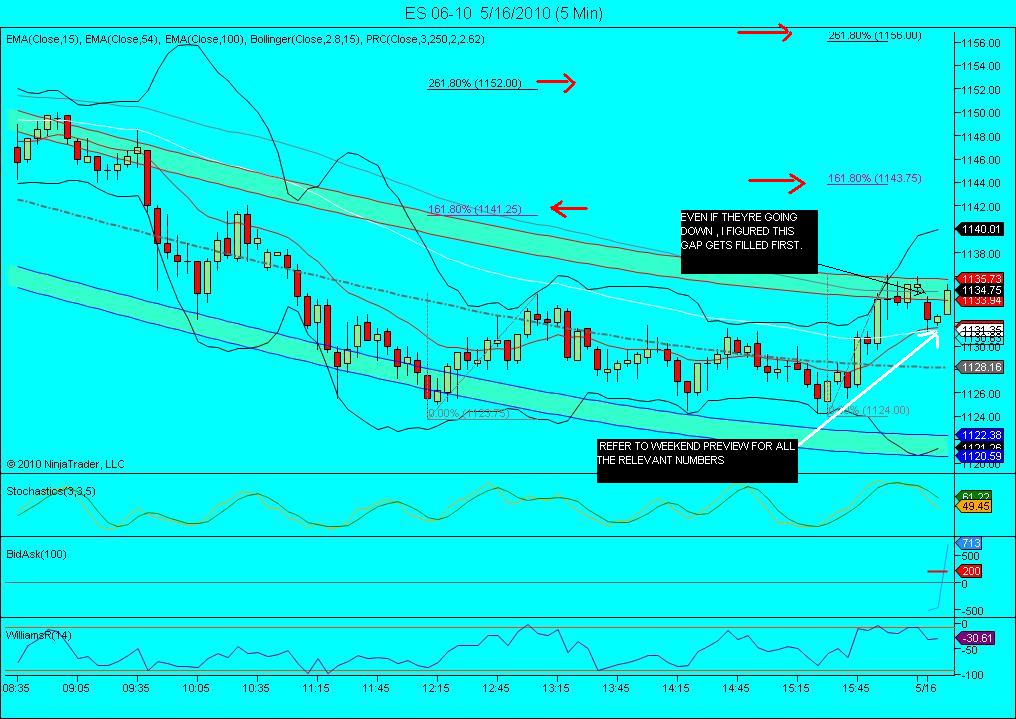
bias basically to the upside ,expecting a peak sometime today.. went long 1131.50 the red avg 5 min chart , just looking for the gap fill off the open to around 1135. COVERED AT 1134.50! that was a no brainer trade... now i can relax at work tonite... see ya in the morning!...
Click image for original size
Hey Kool,
What are those green bands you have on that chart?
What are those green bands you have on that chart?
Piker, they are linear regression bands tied to an avg so they constantly adjust.... experimental
They look pretty smooth. Do they ever repaint, etc?
yeah...lol. thinking about turning them green cause they made me lots of coin today!
Sorry ,bears, but thats a nice bullish candle on the daily chart now.
Still have that gap at 1107.50. Came close to filling it today. Guess it will have to wait for now.
Kool I have been playing around with many emas and settings and cant come up with anything like your chart. Give me a clue as what to use:}
same for the last few years ,R burns! the red is 15 period ema, the white is (my average) the 54 period ema, and the grey is (ptemini's) 100 period ema
Kool I am not getting the lr line and envelope.
Originally posted by koolblue
yeah...lol. thinking about turning them green cause they made me lots of coin today!
They look like green tire tracks going across the chart.
Looks very similar to the chart formation in early Feb on the daily. I wouldn't be arguing with the market right now. I agree with Kool that yesterday was a dagger in the heart of the bears. 40 is still immediate resistance then 55. See how the news is received. Looking for bearish news to be discounted the more of the same candlesticks. Low opens and high closes. A couple of those strung together and its time to get heavily long. Might miss this move, but that's the ideal set up for me.
Emini Day Trading /
Daily Notes /
Forecast /
Economic Events /
Search /
Terms and Conditions /
Disclaimer /
Books /
Online Books /
Site Map /
Contact /
Privacy Policy /
Links /
About /
Day Trading Forum /
Investment Calculators /
Pivot Point Calculator /
Market Profile Generator /
Fibonacci Calculator /
Mailing List /
Advertise Here /
Articles /
Financial Terms /
Brokers /
Software /
Holidays /
Stock Split Calendar /
Mortgage Calculator /
Donate
Copyright © 2004-2023, MyPivots. All rights reserved.
Copyright © 2004-2023, MyPivots. All rights reserved.