ES Short Term Trading 5-18-10
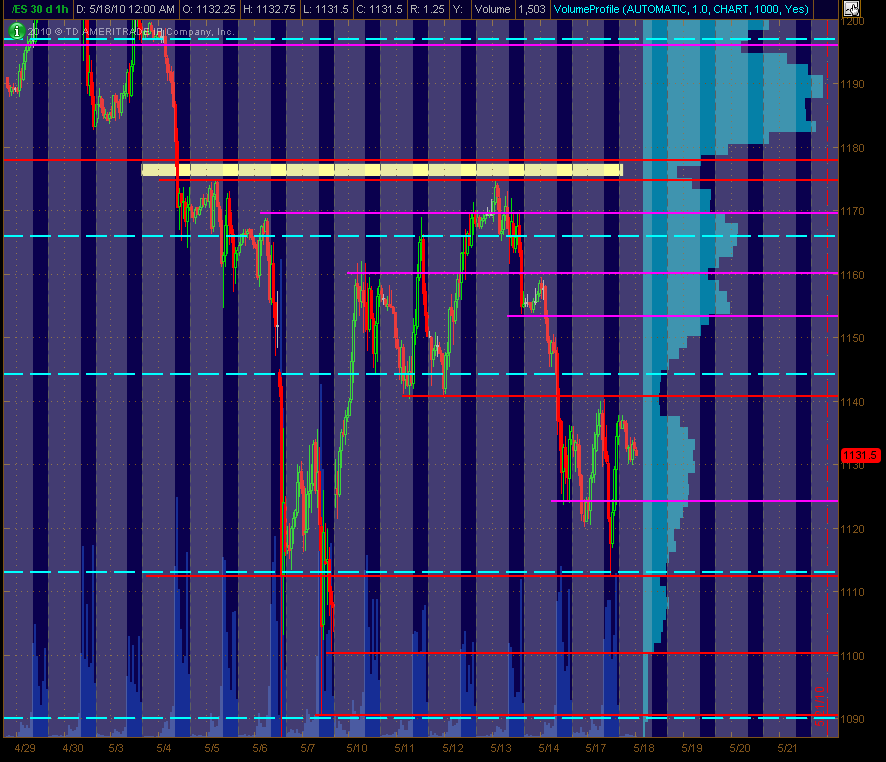
Here's my 30m ES chart with S/R levels based on price action ... Red are potential significant levels with Magenta as semi-significant ones. The Cyan dashed lines are the Weekly Pivots. This is a map for trading coming into Tuesday for me. There's also a Volume Provile of the past 30 trading days shown on the right side of the chart. Hope it's helpful to all.
Click image for original size
they need to make me happy and run through that ledge..just so I don't feel bad
am I the only ass left here today that expects this down rotation to end soon and at best chop around to higher in trade? If this period could just run that ledge out...I'll entertain the long side
if they closed "P" period now we would have single prints in the 19 - 21 range....so longs should go fill it at some point
too bad I can't vote this post up...........LOL
Originally posted by BruceM
am I the only ass left here today that expects this down rotation to end soon and at best chop around to higher in trade? If this period could just run that ledge out...I'll entertain the long side
considerate it voted up
you got my vote...
to answer no you are not.....
i'm the bigger ass for multiple attempts. my bias screwed me today.
i made someone some money.
to answer no you are not.....
i'm the bigger ass for multiple attempts. my bias screwed me today.
i made someone some money.
but that was a damn good trade....that was the 5th conscecutive lower low on the 30 minute so we were due to rotate up...especially after they busted that ledge,,,,,icouldn't snap a picture of the profile as I was actually trading it...and now it's filled in...
I got killed today. I was to scared to pull the trigger when I should made up for it pulling it when I shouldn't. Same old mistake
Emini Day Trading /
Daily Notes /
Forecast /
Economic Events /
Search /
Terms and Conditions /
Disclaimer /
Books /
Online Books /
Site Map /
Contact /
Privacy Policy /
Links /
About /
Day Trading Forum /
Investment Calculators /
Pivot Point Calculator /
Market Profile Generator /
Fibonacci Calculator /
Mailing List /
Advertise Here /
Articles /
Financial Terms /
Brokers /
Software /
Holidays /
Stock Split Calendar /
Mortgage Calculator /
Donate
Copyright © 2004-2023, MyPivots. All rights reserved.
Copyright © 2004-2023, MyPivots. All rights reserved.