ES Short Term Trading 5-21-10
With the mkt getting so volatile and funkadelic, thought I'd just go to the big picture with a Daily chart showing the 50 and 200 day sma's along with what I'm seeing as significant Price Action S/R levels in Red. The chart is a 3-year Daily (Continuous Contract) chart including a Volume Profile.
Don't really see a pattern of classical or more recent origin other than a potential forming of a Head and Shoulders ... potentially a "Rolling" H&S. For the short and even intermediate term (almost), the mkt is "oversold" ... whatever that truly means.
But since the Flash Crash and all the subsequent volatility and erratic price movement, it's even more challenging with Op-Ex Friday. I still think that MP has been describing the market the best, especially as translated by BRUCE!
Don't forget to also track intraday the NQ and YM, looking at relative strength or weakness compared to the ES. Others have commented on NQ being a leading/early-warning of where the ES might travel during the trading session.
So here's the chart. Fyi, I trade stocks mostly and this functions as a market map for me ... which is also why I don't post much intraday unless I'm more focused on and TRADING the ES.
Click image for original size
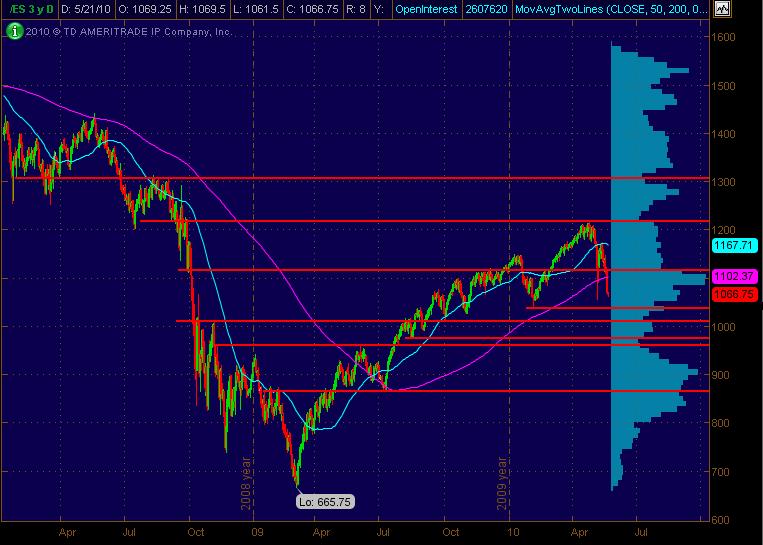
As far as potential significant price levels, here's what I'm seeing, walking it down on the Daily chart from the bigger perspective:
1305
1216
1115
1036 - not only a Daily PASR, but also Wkly S3 Pvt and Daily S2 Pvt
1010
975-960 zone
865
Hope this bigger pic of the mkt is useful in some way with any and all here and the individual trading strategeries/methods employed. Looking for any and all to dive in and be part of this daily trading thread ... Bruce is trading and educating ... Kool posting good stuff ... and a few others. Interact; offer your inputs ... and anything ya don't understand from another's post, simply ask for clarification. It's ALL GOOD HERE!!!!
Thanks for all the good words and support from yourself and others MM.
Personally I'm a bit disappointed in my Market profile charts and recaps for end of day because they aren't doing what I thought they would.
This entire down move has puzzled me as we aren't getting much trade outside of the first hours range in the RTh session and so much seems to be happening in the O/N session....
Again we see a symetric session...today in RTH....there still is a tooth missing at that 1082 number which I really thought they would do some more work on.
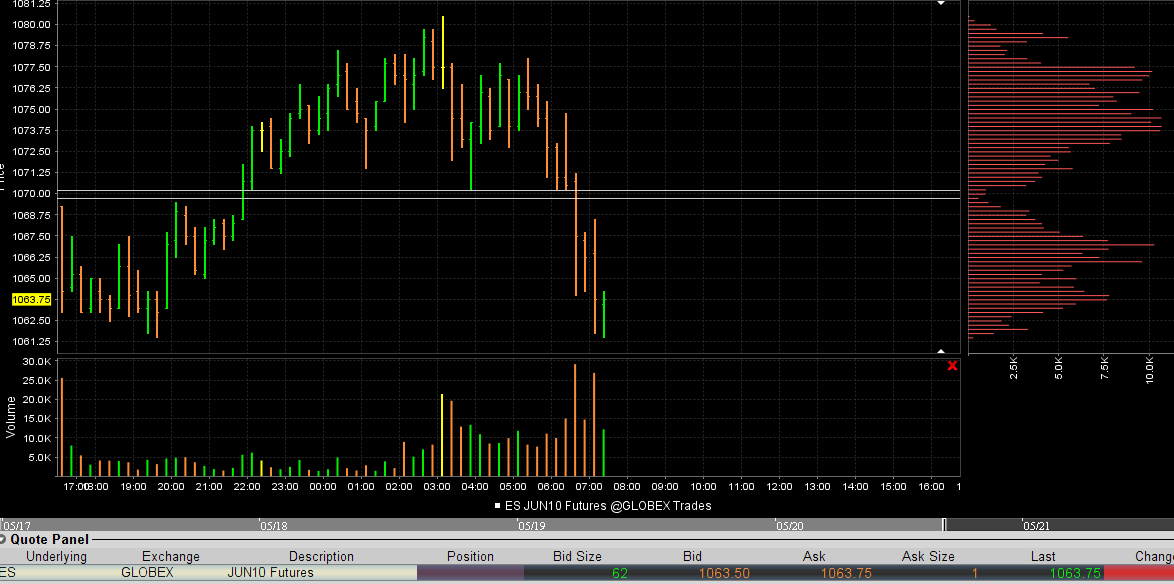
Something I've been watching and am fairly impressed with are the key numbers and the splits....see the 62.50 on the O/N low...that is the split of 75 and 50 key number....87.50 was a split...to further define zones we can split the splits...so every 6.25 points.....add that to the 87.50 and you get todays highs....where was the RTH low..? 6.25 points below the 75 number...
Obviously this is a work in progress but just throwing it out there...a thread at a later date...
Perhaps this is all a smoke screen and tomorrow we get the mother of all rallies... just can't fiqure out why no selling is happening outside of the first hour...
Thanks for the numbers and charts
Personally I'm a bit disappointed in my Market profile charts and recaps for end of day because they aren't doing what I thought they would.
This entire down move has puzzled me as we aren't getting much trade outside of the first hours range in the RTh session and so much seems to be happening in the O/N session....
Again we see a symetric session...today in RTH....there still is a tooth missing at that 1082 number which I really thought they would do some more work on.
Something I've been watching and am fairly impressed with are the key numbers and the splits....see the 62.50 on the O/N low...that is the split of 75 and 50 key number....87.50 was a split...to further define zones we can split the splits...so every 6.25 points.....add that to the 87.50 and you get todays highs....where was the RTH low..? 6.25 points below the 75 number...
Obviously this is a work in progress but just throwing it out there...a thread at a later date...
Perhaps this is all a smoke screen and tomorrow we get the mother of all rallies... just can't fiqure out why no selling is happening outside of the first hour...
Thanks for the numbers and charts
using the obvious highs and lows of the current O/N....but there is a hole in the chart at 1070 ..ON which I'm trading for off of 62.50 print....
further keys on the downside...
56
50
obvious caution due to volatilty...so trading lighter
81 - 84 is a big attractor and longs will need to get over that,,,a good target in RTH..
further keys on the downside...
56
50
obvious caution due to volatilty...so trading lighter
81 - 84 is a big attractor and longs will need to get over that,,,a good target in RTH..
That 960 level looks like a magnet
a look at the hole....where have I seen this cleavage before....?
Tricky here in O/N....not convinced it will run back to fill it in
Tricky here in O/N....not convinced it will run back to fill it in
Click image for original size
took the loss at 61.25 as they consolidated on that low...will try again..
Long 58 even..air pocket above now
Long 58 even..air pocket above now
Yesterday was one of the most frustrating days I have gone through in months. Today's a new day.
There is a cash (SPX) gap still open from the 2/8/10 close, this was the lowest close in Feb before the straightline uptrend.
S&P 500 cash (SPX) The unfilled portion of the gap is from 1059.34 down to 1056.74. If price were to print in this zone it would be a complete round trip of the Feb Lo to the April H. Incidentally, from Feb low to APril high = 53 trade days, from APril H down to today would be the 19th trade day, when markets drop, they often do it in less than Half the time it took them to rise.
Due to variences in fair value (screws up absolute nominal prices for comparing futures gap fills), I usually use SPY gap as an alert, and additionally, I give price a buffer (sometimes close is close enough, just getting close is when you pay attention):
if SPY price prints within 12 cents of the top of the gap, I look for a bounce. Technically, I cannot rule out a complete retracement that undercuts the Feb Lows, but at gap fill (or close...IF it occurs), I will be looking for 1-2-3 in 1 minute.
SPY gap is from 106.11 down to 105.89.
add 0.12 to the 106.11 gives me 106.23-105.89 alert area.
air filled at 61.25...
sorry to hear about YD paul but as u say "today is a new day"...I'm really surprised how this sell off is taking place.....with basic neutral days and volume being symetric on these down days....
How come we aren't seeing any single prints from the market profile and they are fighting all these drops and selling isn't taking place outside the 60 minute range.......just strange....I'm stubborn and will still be looking long in the RTH session
This seems like a crappy O/N low and I'm expecting them to tag the 56.50 if not more...we need some impulse buying!!
best for me is 64.25 and have one left to try for that 69 - 70 fill...I was really expecting them to test that low........
split number of 62.50 and I subtracted 6.25 points....gets ya 56.25....somebody is front running me.....
split number of 62.50 and I subtracted 6.25 points....gets ya 56.25....somebody is front running me.....
Originally posted by feng456
Guys what is a good way (maybe tried and tested personal experience?) of raising one's confidence?
Feng, I tried to answer your question here:
http://www.mypivots.com/Board/Topic/5713/1/how-to-build-confidence
I thought it would be better as its own thread, so as not to hijack this one, and to have it where more people would read it.
Emini Day Trading /
Daily Notes /
Forecast /
Economic Events /
Search /
Terms and Conditions /
Disclaimer /
Books /
Online Books /
Site Map /
Contact /
Privacy Policy /
Links /
About /
Day Trading Forum /
Investment Calculators /
Pivot Point Calculator /
Market Profile Generator /
Fibonacci Calculator /
Mailing List /
Advertise Here /
Articles /
Financial Terms /
Brokers /
Software /
Holidays /
Stock Split Calendar /
Mortgage Calculator /
Donate
Copyright © 2004-2023, MyPivots. All rights reserved.
Copyright © 2004-2023, MyPivots. All rights reserved.