ES short term trading 5-24-10
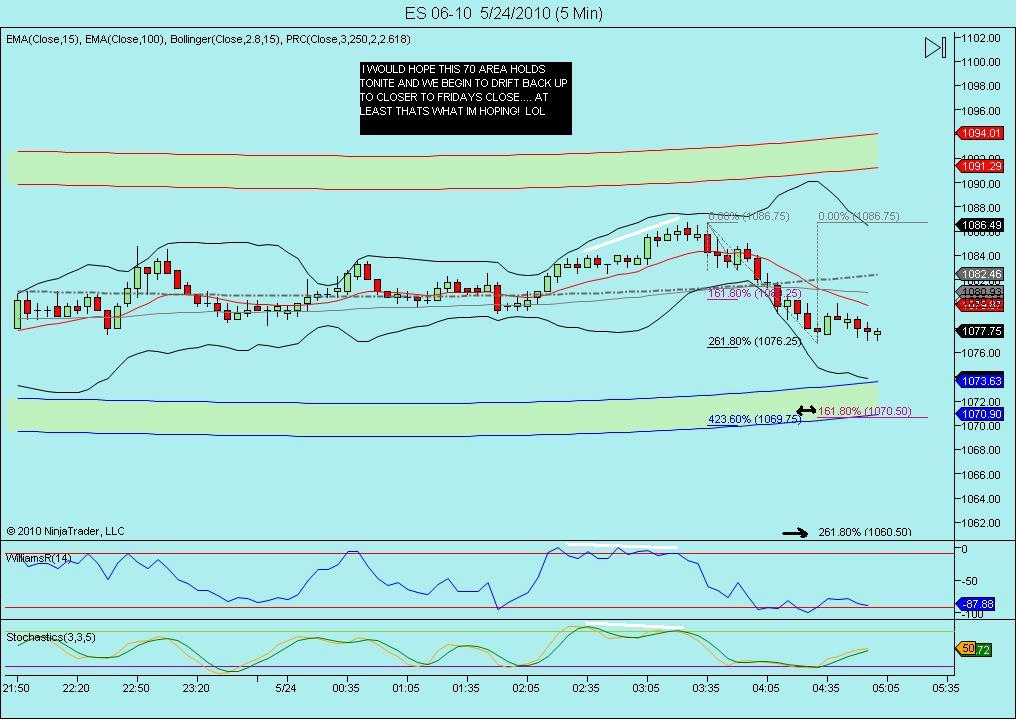
The 24th. Could be an important turn date, but it wont be easy. Volitility should stay high since there was a solar day this weekend which should influence friday and today. Well the short term projection down was 1076.25 and we've hit that and filled the air at 1075.25. Going to get some sleep but heres a short term snapshot for globex....
Click image for original size
An interesting look at this weeks cycles, courtesy Helge...
Click image for original size
some good zones shaping up for the RTH session..
66 - 68.75*****
75
81-82.50
87 -88.75 ****
93.75 - 99****
we've spent alot of time at the 83 - 86 area the last two RTH days..so we basically have two overlapping zones up there. Logic tells us that we will either accept that and get above it and then hold above it to rally up or we will bump up againtst it and rollover down.....no rocket science there...
Although we had good and fast buying on the lows Friday, we just chopped up and really didn't do much after that....options expiration pehaps...who really knows...I prefer seling the rallies today
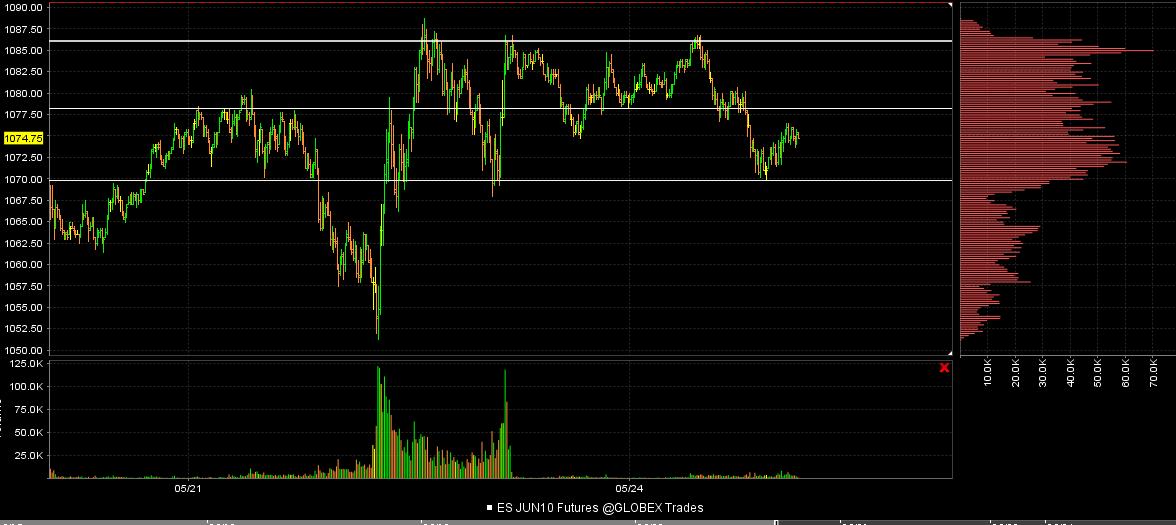
Here's a shot of the slightly bigger idea I'm working from...the past two days we have all this volume in the 1069 - 1086 area....so we can consider that a range.....If we rally above that high will we continue ? If not we will fall back inside to the center at least..
If we drop below are we selling off on volume...? If not we will go back to the center....some other things I'm storing in the back of my mind are the concepts of where the weekly pivot is and the weekly lows and highs..we know thet like to test them....good luck today
If we drop below are we selling off on volume...? If not we will go back to the center....some other things I'm storing in the back of my mind are the concepts of where the weekly pivot is and the weekly lows and highs..we know thet like to test them....good luck today
Click image for original size
As far as potential price action S/R levels go, I'm seeing:
1098-1094 as signif resist zone that also includes Wkly Pvt @ 1094 and Daily R1 @1098
1088 area looking at Thurs and Fri RTH action
1068-67 from Thurs O/N and Fri RTH action
1061 as next more minor potental support below
1051 for obvious reasons
ON range is 17 points currently ... will be interesting to see what we do at the 1070 low and 1086.75 high. No real directional bias today but see the area just under 1100 as pretty signif resistance ... report out at 9am CST
Here's an Hourly chart of past 30 days:
Click image for original size

Noticed I had 3 of the same areas Bruce has ... coming at it from a bit diff analysis perspective ... and Kool has a projection down on his chart at 1061 area also ... maybe provides more signif to those prices ... we'll see.
Addendum: As always, will be constantly minitoring tha Naz, Dow (and Russell) futures intraday charts to aid my view of what ES is doing and likely to do.
Addendum: As always, will be constantly minitoring tha Naz, Dow (and Russell) futures intraday charts to aid my view of what ES is doing and likely to do.
Good chance we trade on both sides of the open print which goes well with selling any rally up here in early trade...
sorta followed my plan? ok fine i guess i didnt...not 100% :(
81.25 is now the pivotal number which will decide if we go get the 75 number or the 87.50 area
Bruce could you explain why that number. TIA RB
gheesh 56.25 ...wow !! if this fails then 50 number is next....anyone see the progression or is it lost...??? personally I'd like to see it hold for the 62.50 retest
Emini Day Trading /
Daily Notes /
Forecast /
Economic Events /
Search /
Terms and Conditions /
Disclaimer /
Books /
Online Books /
Site Map /
Contact /
Privacy Policy /
Links /
About /
Day Trading Forum /
Investment Calculators /
Pivot Point Calculator /
Market Profile Generator /
Fibonacci Calculator /
Mailing List /
Advertise Here /
Articles /
Financial Terms /
Brokers /
Software /
Holidays /
Stock Split Calendar /
Mortgage Calculator /
Donate
Copyright © 2004-2023, MyPivots. All rights reserved.
Copyright © 2004-2023, MyPivots. All rights reserved.