ES Short Term Trading 6-1-10
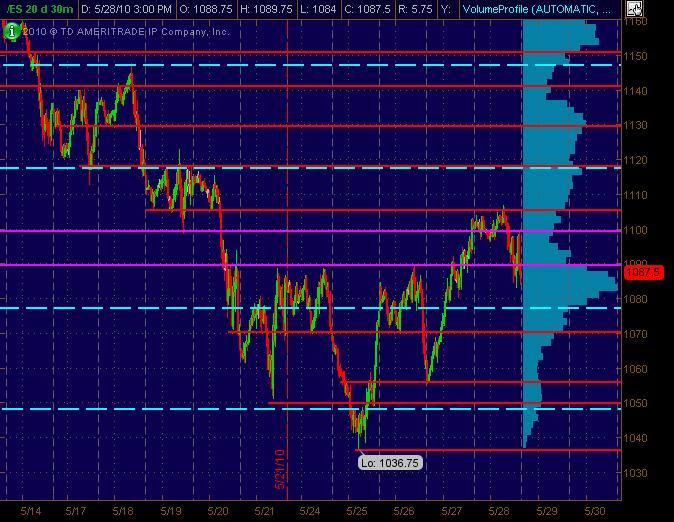
Tossing out two 30m (20 day) charts here with the Red lines as potential significant S/R price action levels with the Magenta lines "semi-significant." The dashed Cyan lines are the Weekly Pivot levels. Also, there's a Volume Profile on the right vertical side of the charts that can be useful.
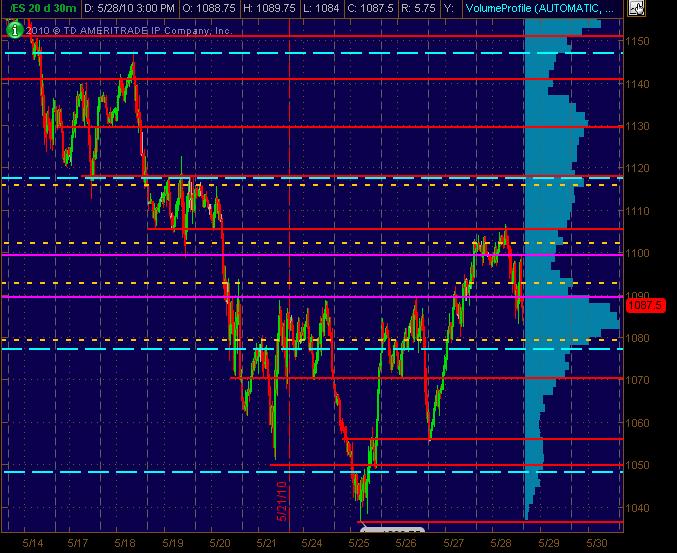
The 2nd chart adds the Daily Pivots in dashed Yellow. Yeah, yeah, yea ... I know, tons of lines so that any will "work." That's not the point. It's a MAP. And it's also about clusters of lines that are in the same price "zone" give or take a few ticks or points (depending on the volatility).
Hope y'all find this at least semi-useful and look forward to postings of everyone elses analysis of drawn-charts and significant numbers!
The 2nd chart adds the Daily Pivots in dashed Yellow. Yeah, yeah, yea ... I know, tons of lines so that any will "work." That's not the point. It's a MAP. And it's also about clusters of lines that are in the same price "zone" give or take a few ticks or points (depending on the volatility).
Click image for original size
Click image for original size
Hope y'all find this at least semi-useful and look forward to postings of everyone elses analysis of drawn-charts and significant numbers!
Its a short not a long feng
weird i somehow got filled long at 77.50, a full point below open. mustve spiked down when i clicked.
Well you got your 2 pts, congrats
yea if that fluke didnt happen i wouldve been filled about a minute ago at around 80.25
Originally posted by BruceM
If we live long enough we should see all these prices again....LOL! for me I need a time frame to make that usable....I stick to the Rachets!!Originally posted by ak1
All that I know is that selllers are waiting at 1078 and 1072 to cover losses. We should see 1069 but when time will tell.....
Looks like Bruce we both lived long enough
We should see 1076
And 1093.00 hopefully today
83.75 --> 85.25 is air yea? and 87.5 is a Rat. so maybe good place to short?
air at 83.75 off the 87.50..that's two ratchets.( 81.25 printed)..where will the thrid one come ? that is your job...ratchets evolved from my attempt to hold runners longer....
correct Feng...on the flipside we always need to monitor "air" as it gets tested and doesn't fill in then that can be telling you something about strength or weakness of the market
AK1,
I can't get the context of your first set of numbers so I will be starting with the second ones you have labeled at that swing low..
The key is that you need to expecting a swing low based on your work so lets assume that.
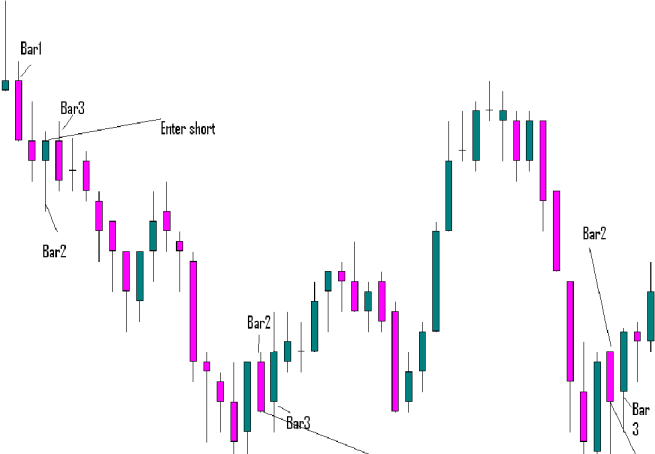
You get the up close which comes right before bar 2. Then bar 2 attempts to test the swing low so you go long on the break of the bar two high which was bar 3. The great thing is that it would take and outside bar down on bar 3 to stop you out on the same bar as your entry.
the next swing low you have labeled does the same thing. the one before bar two gives you the up close, then you getthe test down with bar two, so you go long on the break of bar two's high at bar three..
The two swing highs in between these lows could have been trade in the same way...At those swing highs you get a down close, followed by an upwards test, so you would go short on the break of the low of the up close bar.....hope you see those...it's a simple pattern once you start looking for them...they can work on all time frames
I can't get the context of your first set of numbers so I will be starting with the second ones you have labeled at that swing low..
The key is that you need to expecting a swing low based on your work so lets assume that.
You get the up close which comes right before bar 2. Then bar 2 attempts to test the swing low so you go long on the break of the bar two high which was bar 3. The great thing is that it would take and outside bar down on bar 3 to stop you out on the same bar as your entry.
the next swing low you have labeled does the same thing. the one before bar two gives you the up close, then you getthe test down with bar two, so you go long on the break of bar two's high at bar three..
The two swing highs in between these lows could have been trade in the same way...At those swing highs you get a down close, followed by an upwards test, so you would go short on the break of the low of the up close bar.....hope you see those...it's a simple pattern once you start looking for them...they can work on all time frames
Originally posted by ak1
DT please help so that Bruce's concept can be shared
Click image for original size
Emini Day Trading /
Daily Notes /
Forecast /
Economic Events /
Search /
Terms and Conditions /
Disclaimer /
Books /
Online Books /
Site Map /
Contact /
Privacy Policy /
Links /
About /
Day Trading Forum /
Investment Calculators /
Pivot Point Calculator /
Market Profile Generator /
Fibonacci Calculator /
Mailing List /
Advertise Here /
Articles /
Financial Terms /
Brokers /
Software /
Holidays /
Stock Split Calendar /
Mortgage Calculator /
Donate
Copyright © 2004-2023, MyPivots. All rights reserved.
Copyright © 2004-2023, MyPivots. All rights reserved.