ES short term trading 6-3-10
Good morning crew,
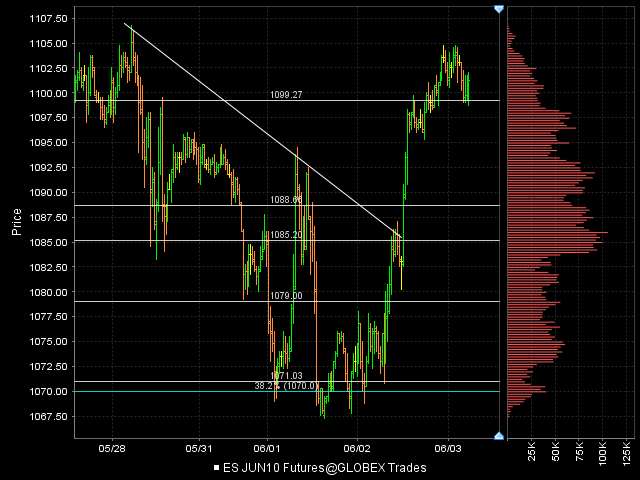
O/N Market had slightly upward bias O/N range is 1096 - 1104
1105 is resistance from last week
1097-1098 is yesterday's gap fill and daily hi
1084-1086 is friday's low, Tues. VPOC, POC and reaction area from last week.
1081 was the start of Mon. breakdown, and start of yesterday's breakout.
1069-1070 is an unfilled gap and double bottom (more obvious on a volume chart)
Today's stretch (from opening price) is 7pts.
Price is currently above the value areas of all sessions since May21.
Euro was slightly weak in the European session, and this morning's 830 am economic releases were slightly below expectations, but mkt response has been non-chalant.
Today is MATD, so my guess for the initial MATD oscillation points are:
1105-1106
1090-1094
Today's daily Range estimate is 1087 - 1112
Based on current mkt strength, I think mkt will probe the 1105-1106 area first before attempting to fill gap (1097).
Click image for original size
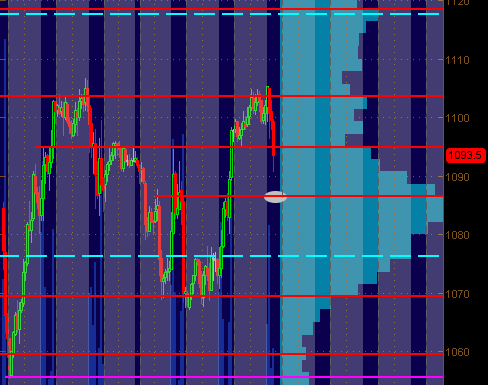
flat at 1100.75...big wad of volume just stuck in the middle of this range...my tpo count has sellers in control but conflicted by the gap at the highs.....just standing aside until new highs or lows trade on the day
I agree...too busy trading sometimes to give credit...but rock solid analysis phileo
Originally posted by MonkeyMeat
Originally posted by phileo
Based on current mkt strength, I think mkt will probe the 1105-1106 area first before attempting to fill gap (1097).
Good analysis and market read from your initial post of the morning.
this will be a first in my memory that a gap on the high stays if it is not cleaned up by days end.....no hard stats...just my faded mememory....so I'm still trying for it...if only I could find a signal within this hour range and lunch time...yikes
ledge will form at the double 5 minute low if this 30 minute bar closes without running it out..FYI
Since the MATD (Morning After Trend Day) is a Don Miller thing, I've been searching the net for his definition of a "trend day" and have yet to come up with any useful description. MATD definition link.
Anyone here know or have any idea of Don's definition of a trend day for his subsequent MATD trading? Would be helpful since it's come up several times recently on other topics/threads?
Anyone here know or have any idea of Don's definition of a trend day for his subsequent MATD trading? Would be helpful since it's come up several times recently on other topics/threads?
Originally posted by day trading
Originally posted by PAUL9
phileo,
can you describe in some sort of quantitative way what a trend day is?
in other words, is it a day where RTH 30 minute bars only have 1 or 2 bars where previous 30min bar low is undercut...
is there any mathematically expressed condition that exists on a "trend" day?
I know that this question is directed at phileo but I can try and answer it as it's a question that I've been struggling with for years. Here are some rough rules from memory for how I have flagged a trend day after the day's trading has completed. (i.e. can't determine during the day.)
That does not guarantee that you'll pick out a range day (for back testing for example) but it does catch a lot of them. There are other techniques like calculating the linear regression of the average of the 5 minute OHLC bars and then examining the price points along that regression line to determine how far they fall from the line. I have never tried that though...
- Open is within 10% of high or low and close is within 10% of opposite high or low. (Percentage based on range. e.g. if range is 20 points then open must be within 2 points of high/low.)
- Range is no less than 75% of 5 day average range.
Originally posted by PAUL9
phileo,
can you describe in some sort of quantitative way what a trend day is?
in other words, is it a day where RTH 30 minute bars only have 1 or 2 bars where previous 30min bar low is undercut...
is there any mathematically expressed condition that exists on a "trend" day?
Hi Paul,
Didn't want to hijack this thread, so I posted on a new thread.
http://www.mypivots.com/Board/Topic/5756/1/recognizing-trend-days
In a nutshell, no.
The closest thing I came up with that's closest to being quantitative is to look at VWAP.
Originally posted by BruceM
I agree...too busy trading sometimes to give credit...but rock solid analysis phileoOriginally posted by MonkeyMeat
Originally posted by phileo
Based on current mkt strength, I think mkt will probe the 1105-1106 area first before attempting to fill gap (1097).
Good analysis and market read from your initial post of the morning.
LOL!
I'm just an armchair quarterback scared by all those HFT robots, I was nowhere close to following that plan.....
One of these days, my pre-trade analysis will line up with my trading actions enough so that I can actually do what I think I will do.
with mkt punching below 1095 and currently bouncing back up to it ... if it can't get above and hold that price at all but rather rolls over ... looking at downside tgt of 87-85 ... a signif Volume levle and semi signif price action Support levle + roughly half retrace of yday's all-hours range (30min chart)
Click image for original size
Regarding a trend day, knowing we had one in retrospect is interesting but what can help make one $ is to recognize one when one is in it and then identify good places to jump on the train and ride it. I know that's like a trader's Holy Grail.
FWIW, I have been playing with Kool's price projection tools for several months and the best way I have found, to this point, to identify and capitalize on an active trend is to watch for Kool's price projections in one direction consistently getting hit / exceeded while those in the opposite direction consistently get missed. The direction of the consistent hits / surpasses is the trend direction until those trend directional projections start to fail. I find when that happens, the trend usually died. I don't have stats to back this up but I have a lot of screen hours and Kools Tools calculations that have born it out for me.
This may not match up with the classic "trend day" definition but working with it can make one some nice $ and keep one out of trouble bucking a trend. Again, FWIW.
Originally posted by phileo
Originally posted by BruceM
I agree...too busy trading sometimes to give credit...but rock solid analysis phileoOriginally posted by MonkeyMeat
Originally posted by phileo
Based on current mkt strength, I think mkt will probe the 1105-1106 area first before attempting to fill gap (1097).
Good analysis and market read from your initial post of the morning.
LOL!
I'm just an armchair quarterback scared by all those HFT robots, I was nowhere close to following that plan.....
One of these days, my pre-trade analysis will line up with my trading actions enough so that I can actually do what I think I will do.
I must say, that was a good plan too.
The problem was I just couldn't hold my 1101.75 short long enough to get the gap fill.
I've signed up for jpjtrading.com's free trial, hopefully they can provide guidance for me on how to hold onto trades longer.....
there was someone here who was looking at triples in the O/N session and then POOF !! They disappeared.....maybe they just made so much money trading for them.....Ha! I hope it keeps running up..triples are all over the place in this O/N but I still want 1105.25 cleaned up...
Originally posted by Piker
Originally posted by BruceM
anyone getting long in O/N..? My world seems to think that tomorrow whould make a HH and HL then today...so why notget in early ? Like at 1100 area....and 1105 still needs work I think...Anybody ? Anybody "
I am long at 1100.75 shooting for the triple at 1104.25, at least initially.
Emini Day Trading /
Daily Notes /
Forecast /
Economic Events /
Search /
Terms and Conditions /
Disclaimer /
Books /
Online Books /
Site Map /
Contact /
Privacy Policy /
Links /
About /
Day Trading Forum /
Investment Calculators /
Pivot Point Calculator /
Market Profile Generator /
Fibonacci Calculator /
Mailing List /
Advertise Here /
Articles /
Financial Terms /
Brokers /
Software /
Holidays /
Stock Split Calendar /
Mortgage Calculator /
Donate
Copyright © 2004-2023, MyPivots. All rights reserved.
Copyright © 2004-2023, MyPivots. All rights reserved.