I just need help, charts are included
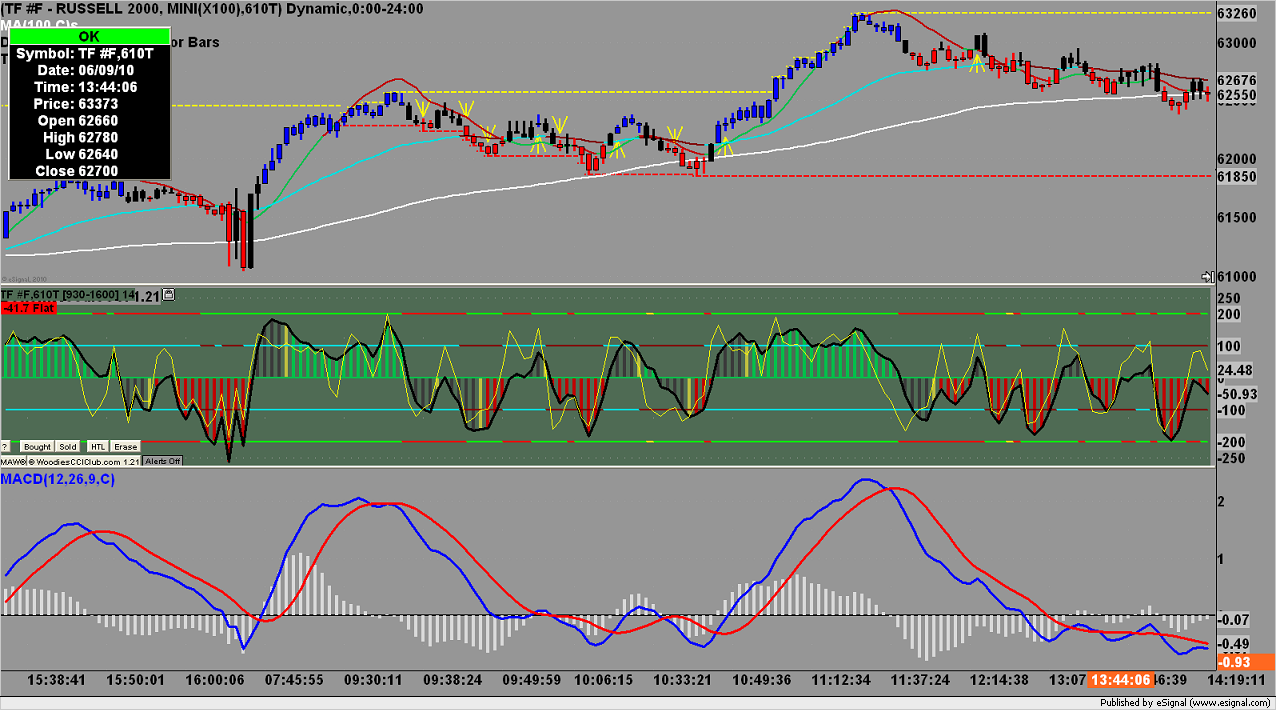
I've been trying to trade the Russell 2000 for six years now. I have had no sucess. The longest I went without losing for the day, was six days. I'm placing some pictures of my trades from today June 9, 2010.
I can not figure out how to get a good entry, that does no constantly go against me atleast 25 ticks. If I set a stop of 15 ticks, it might get hit, most of the time it will. Then again sometimes it will go against me 25 ticks and then turn around and go my way.
Yes I use a MACD, mainly because I can't figure out how to get away from it. I use woodies CCI, and one of my trades is triggered when the 6 period cci ( the yellow line ) closes above or below the zero line. I use a program called " directional breakout " that I downloaded from esignal.
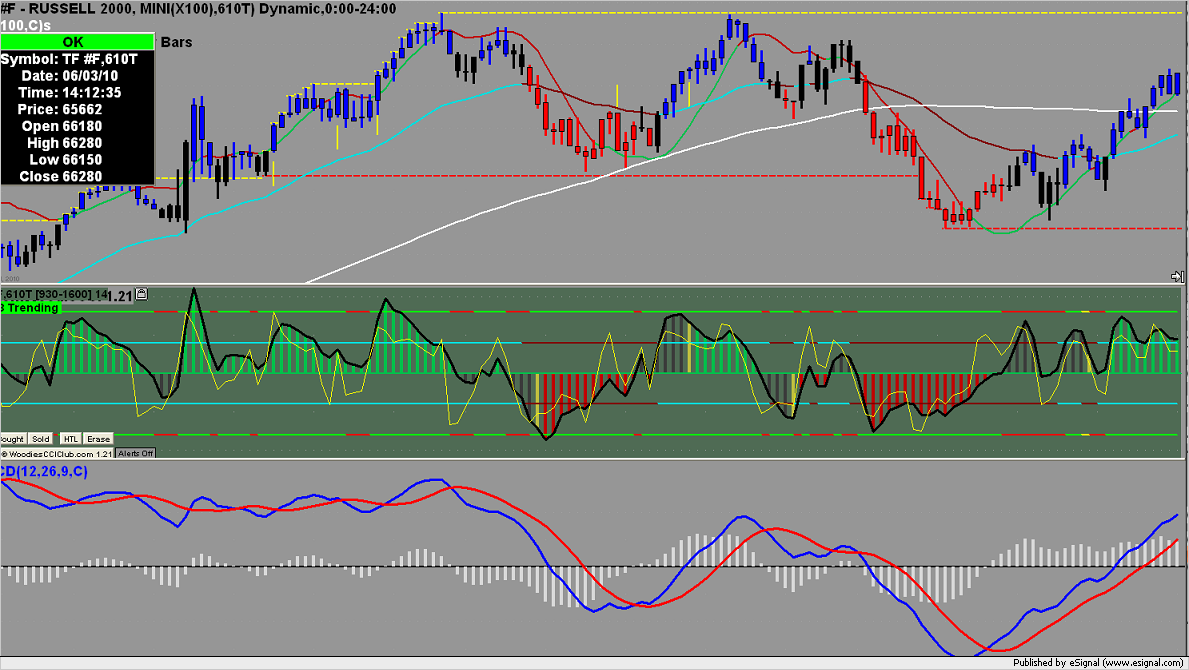
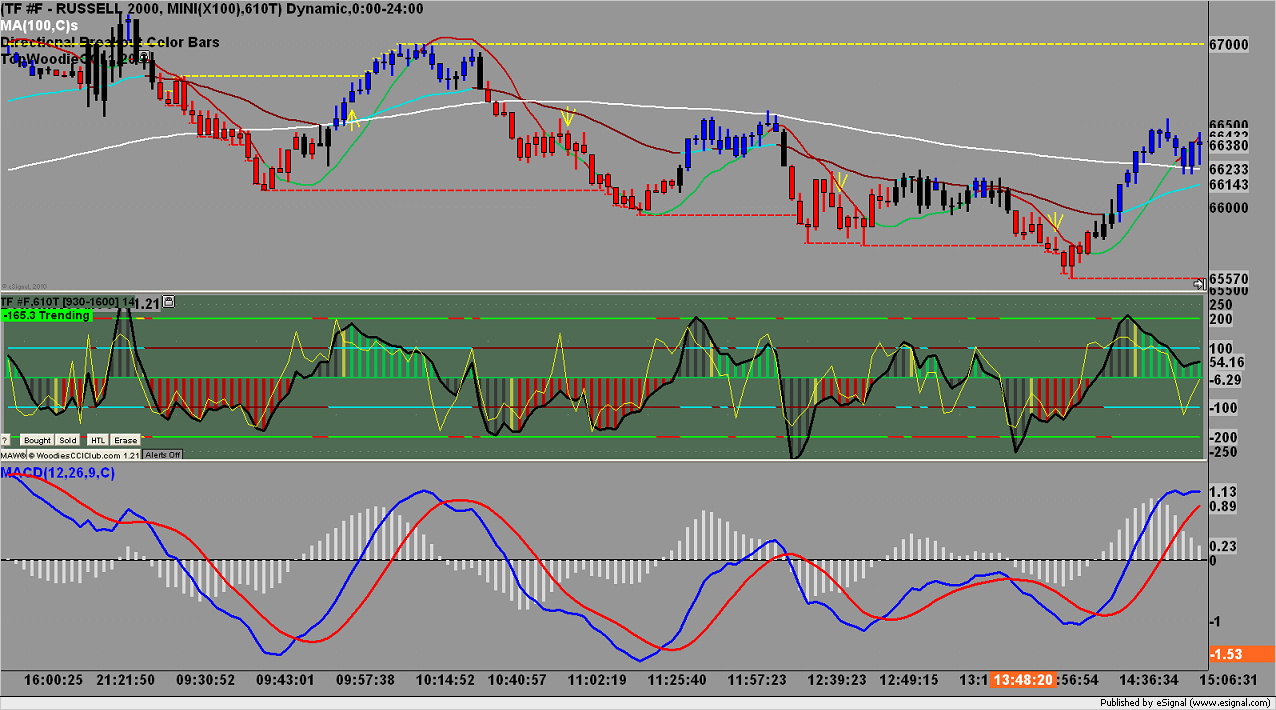
I'm going to upload the past five days charts.
I can not figure out how to get a good entry, that does no constantly go against me atleast 25 ticks. If I set a stop of 15 ticks, it might get hit, most of the time it will. Then again sometimes it will go against me 25 ticks and then turn around and go my way.
Yes I use a MACD, mainly because I can't figure out how to get away from it. I use woodies CCI, and one of my trades is triggered when the 6 period cci ( the yellow line ) closes above or below the zero line. I use a program called " directional breakout " that I downloaded from esignal.
I'm going to upload the past five days charts.
Click image for original size
Click image for original size
Click image for original size

Click image for original size

Click image for original size
The main reason why traders fail is because they rely on indicators that follow the market. Turn them off and try to anticipate points where price action can occure. Take the e.g of Pivot points. Choose a 5 min. price action/pattern that occures around a PP area to make it hold true. Look for repeatation of that pattern. Take the e.g of the price action that occured after 1067 in the S&P after 2:00 est. Had we got an inside bar instead of an engulf the story would be different. Hovere the traders bought too much and had to shed it. Result we all saw.
Gawd I'd like nothing more than to learn to trade without indicators. I know people do this, and they make a living do it. I want to be one of those people Baddddd! Anyways thank you for your input!
Well here is your first lesson. Using a 30 min candle stick chart note the 10:00 est close and use it to enter a trade using a 5 min FEB method.
Skyfly:
I share ak1's view that relying on indicators is a recipe for failure. Especially when using "exotic" timeframes, such as any volume-based, tick-based, even range-based chart. I believe that basic indicators have some value on daily charts, and possibly on wildly used minute-charts (but which minutes-charts are wildly used ?).
(for a good example of what an indicator can show on daily chart, take the SPX daily with ONLY a 200-EMA, and see June 2009 top, Feb 2010 low, and last couple of weeks' highs).
I believe in Price Action (HHs/HLs, LHs/LLs, DT, DB), Market Structure (old pivots forming S/R levels, Elliot impulse & corrective waves, Market Profile) & Price Projections (Fib-based retracements and extensions/expansions). I also and mostly believe we (retail traders) have to understand and anticipate what the big boys are most likely doing, so that we can take advantage of it - rather than suffer from it. I find Volume Spread Analysis to be very helpful,
see Tom Williams "Undeclared Secrets that Drive the stock market" - these concepts work as well on 1min charts as they do on daily charts.
I have no experience trading TF, so can't provide any help for this particular market. I used to trade ES, and came to hate that market because it didn't provide much "high-probability" setups, and I ended-up taking many "lower-probability" setups that would eventually do more bad than good to my account. Add to this that my average win on ES was be 4 to 6 ticks, and you can imagine what a pain it was.
I discovered that there are other markets than stock index futures ... I am currently mainly trading CL (Crude Oil), which has much higher volatility, trends a lot better, longer legs, etc.
I am a strong believer that a solid trading education is a pre-requisite to being successful (but not enough, though). I published in another thread my favorite list of books - I also visited Jim Kane (Kane Trading) website lately, he has an interesting list of suggested books. I honestly thinks books are not enough, you'd better find a mentor to shorten your learning curve.
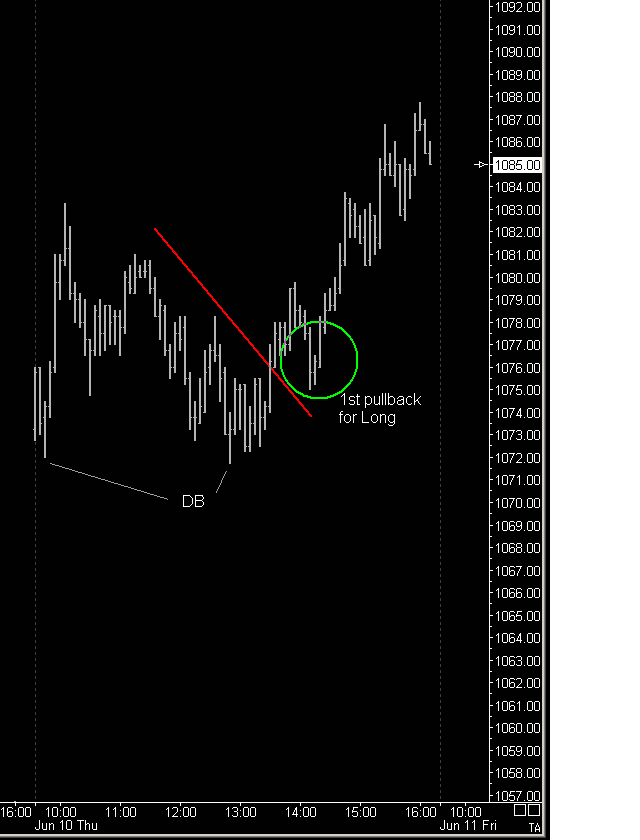
If there was only ONE setup I could trade, it would be the 1st pullback after a DB/DT and clear breakout of the trendline created on the way to the 2nd bottom/top. The example below is from ESM0 5min today, you won't necessary find this setup every-day though.
I share ak1's view that relying on indicators is a recipe for failure. Especially when using "exotic" timeframes, such as any volume-based, tick-based, even range-based chart. I believe that basic indicators have some value on daily charts, and possibly on wildly used minute-charts (but which minutes-charts are wildly used ?).
(for a good example of what an indicator can show on daily chart, take the SPX daily with ONLY a 200-EMA, and see June 2009 top, Feb 2010 low, and last couple of weeks' highs).
I believe in Price Action (HHs/HLs, LHs/LLs, DT, DB), Market Structure (old pivots forming S/R levels, Elliot impulse & corrective waves, Market Profile) & Price Projections (Fib-based retracements and extensions/expansions). I also and mostly believe we (retail traders) have to understand and anticipate what the big boys are most likely doing, so that we can take advantage of it - rather than suffer from it. I find Volume Spread Analysis to be very helpful,
see Tom Williams "Undeclared Secrets that Drive the stock market" - these concepts work as well on 1min charts as they do on daily charts.
I have no experience trading TF, so can't provide any help for this particular market. I used to trade ES, and came to hate that market because it didn't provide much "high-probability" setups, and I ended-up taking many "lower-probability" setups that would eventually do more bad than good to my account. Add to this that my average win on ES was be 4 to 6 ticks, and you can imagine what a pain it was.
I discovered that there are other markets than stock index futures ... I am currently mainly trading CL (Crude Oil), which has much higher volatility, trends a lot better, longer legs, etc.
I am a strong believer that a solid trading education is a pre-requisite to being successful (but not enough, though). I published in another thread my favorite list of books - I also visited Jim Kane (Kane Trading) website lately, he has an interesting list of suggested books. I honestly thinks books are not enough, you'd better find a mentor to shorten your learning curve.
If there was only ONE setup I could trade, it would be the 1st pullback after a DB/DT and clear breakout of the trendline created on the way to the 2nd bottom/top. The example below is from ESM0 5min today, you won't necessary find this setup every-day though.
Click image for original size
Skyfly:
When I start trading all I knew was indicators and Russell 2000 because my mentor use them, but I couldn’t make a single profit week. it was as you said, no matter which way I trade the price always came against me.
But since I found this forum I star using Pivot points, Fibonacci , market profile, start learning price action and the most important thing, I GET RID OF THE INDICATORS, Now I’m doing it very good just looking at the price action without a single indicator.
I trade the Euro 6e, Oil CL and Russell 2000 TF so feel free to send me a PM and I'll be glad to share my little experience with you.
Wow I did think I'd get such a well thought out response from you guys. I really appreciate it. Thank you all for your thoughts. I guess the only thing for me to do is to get rid of the indicators, and contact the people who said they would show me a few things.
I got admit, that learning to anticipate the "big boys" sounds just insane to me. I'm wondering how you write rules around learning to anticipate candles, or formations. The set up that was shown, was very nice. Now that I look at it, I can find it alot on the Russell 2000. How do you determine the pull back though? Does it have to pull back a certain percent? Just wondering.
Thank you again for your thoughts.
Oh what is DB? Oh never mind, Double bottom...duh...lol
Originally posted by Skyfly
I got admit, that learning to anticipate the "big boys" sounds just insane to me.
This is where Market Profile, Volume Spread Analysis - and a huge amount of screen-time - can really help
Originally posted by Skyfly
The set up that was shown, was very nice. Now that I look at it, I can find it alot on the Russell 2000. How do you determine the pull back though? Does it have to pull back a certain percent? Just wondering.
Entry in pullback ... the $1,000,000 question ... essentially, you can either let it pullback to a predefine retracement level, or enter on a breakout of the deepest (in the pullback) 3min or 5min bar (or a combination of both)
I see, ok thank you :)
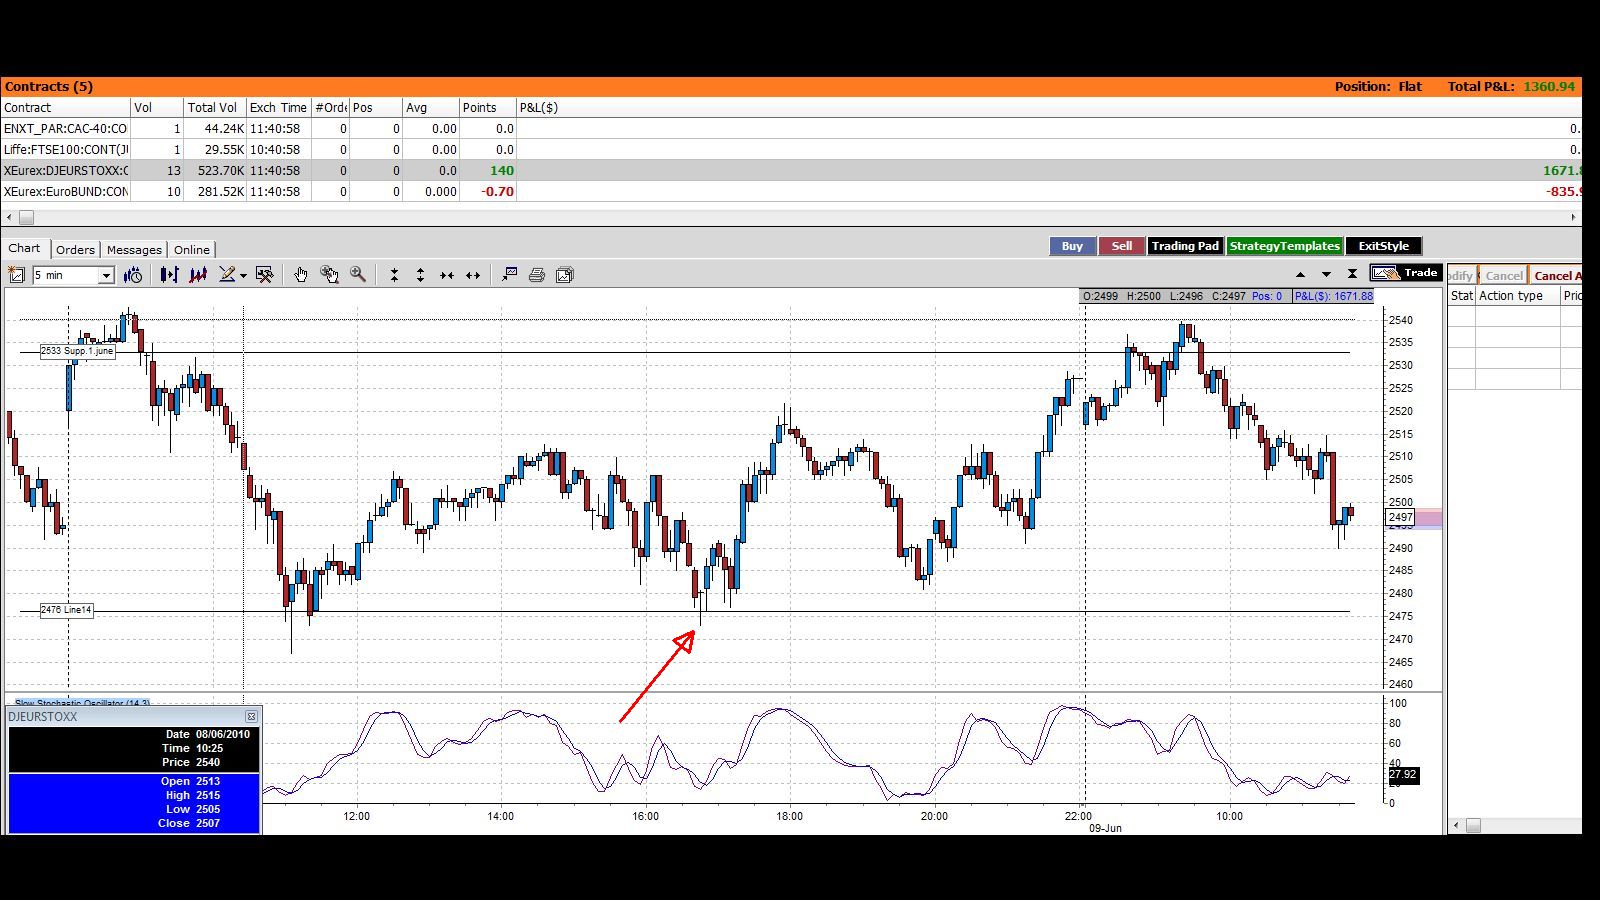
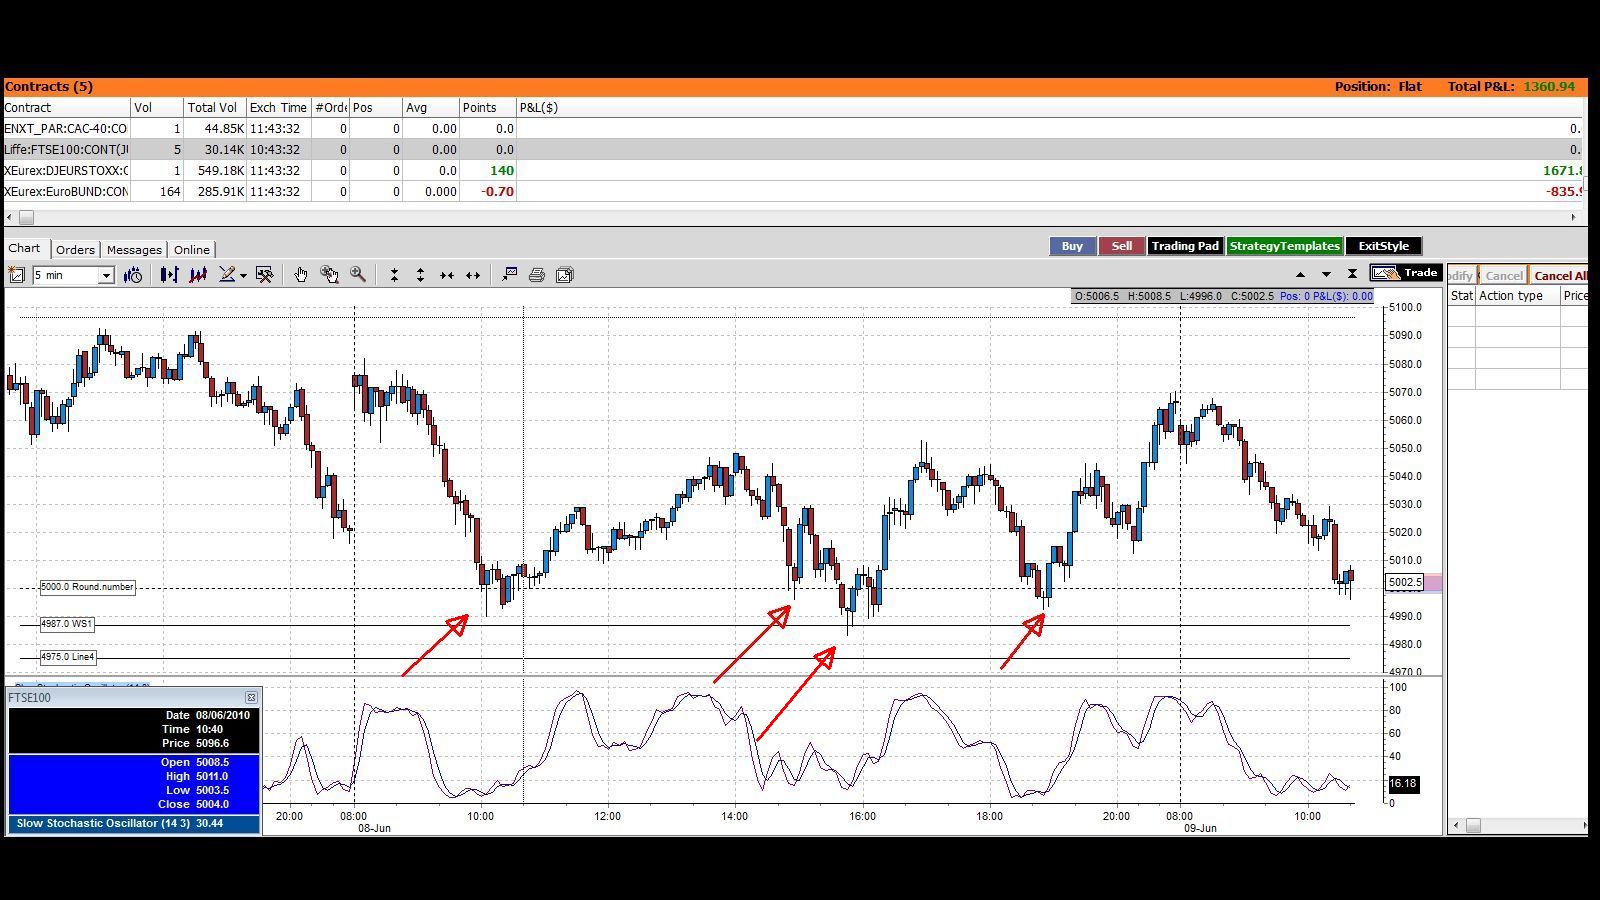
I'd say firstly why are you trading the Russell when there are better options such as the mini S&P, Eurostoxx or Bund (Europe hours). This site is a good resource and you can start by plotting the weekly pivot points and the daily Value Area high and low (market profile) and round numbers like 1000 and 1000 on the mini S&P. Then study PIN bars as described on the james16 chart thread on forexfactory and combine them with your pivots/levels. Then delete all that other crap on your charts. Attached are a couple of examples.
Click image for original size
Click image for original size
Ok thank you I'll start looking into what you are talking about. As well as the other markets. Thank you
Emini Day Trading /
Daily Notes /
Forecast /
Economic Events /
Search /
Terms and Conditions /
Disclaimer /
Books /
Online Books /
Site Map /
Contact /
Privacy Policy /
Links /
About /
Day Trading Forum /
Investment Calculators /
Pivot Point Calculator /
Market Profile Generator /
Fibonacci Calculator /
Mailing List /
Advertise Here /
Articles /
Financial Terms /
Brokers /
Software /
Holidays /
Stock Split Calendar /
Mortgage Calculator /
Donate
Copyright © 2004-2023, MyPivots. All rights reserved.
Copyright © 2004-2023, MyPivots. All rights reserved.