ES Short Term Trading 6-16-10
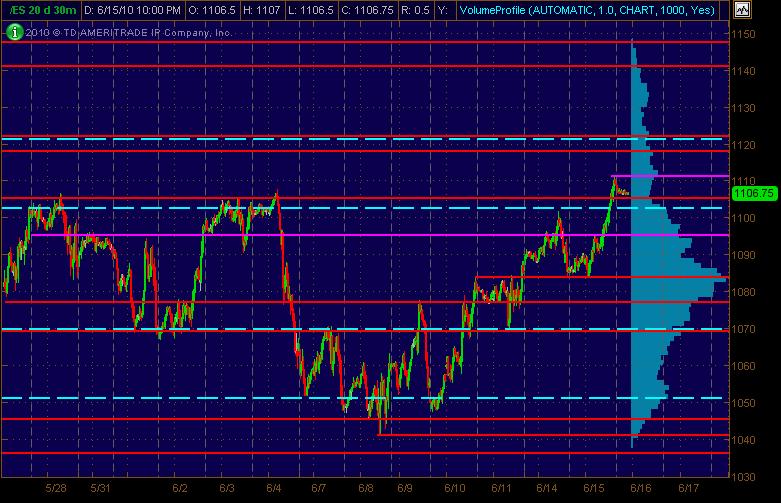
Here's a 30m chart of the last 20 days (continuous contract) with Price Action Support Resistance lines drawn in RED with MAGENTA as semi-significant PASR zones. The dashed CYAN lines are the Wkly Pvt levels. It's simply a "map" for trading Wednesday. Volume at Price is also shown on the vertical right side of the chart.
Click image for original size
Originally posted by PAUL9
I don't know where price will open, but historically (and this is sort of in synch with the MATD observations), gap up or down after day of large unfilled gap will fill roughly 85% of the time.
Where's Phileo?
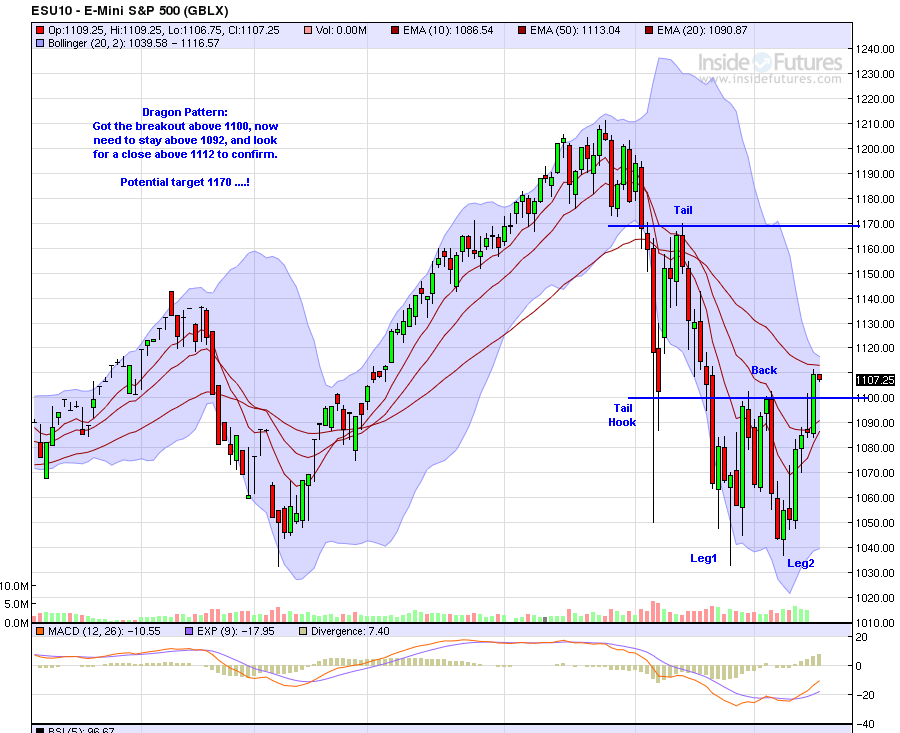
this market (daily bars) has conditions in place that could create a bullish Jerry's Dragon. You seem much more familiar with the formation than I am, what would be a clear sign of confirmation for a successful Jerry's bullish dragon? (if you could)
....
Click image for original size
Hope this helps.
Again, I am not really trusting of these patterns, but when they line up with known support and resistance areas, then it's potentially a different story.....
Emini Day Trading /
Daily Notes /
Forecast /
Economic Events /
Search /
Terms and Conditions /
Disclaimer /
Books /
Online Books /
Site Map /
Contact /
Privacy Policy /
Links /
About /
Day Trading Forum /
Investment Calculators /
Pivot Point Calculator /
Market Profile Generator /
Fibonacci Calculator /
Mailing List /
Advertise Here /
Articles /
Financial Terms /
Brokers /
Software /
Holidays /
Stock Split Calendar /
Mortgage Calculator /
Donate
Copyright © 2004-2023, MyPivots. All rights reserved.
Copyright © 2004-2023, MyPivots. All rights reserved.