Current MP Charts
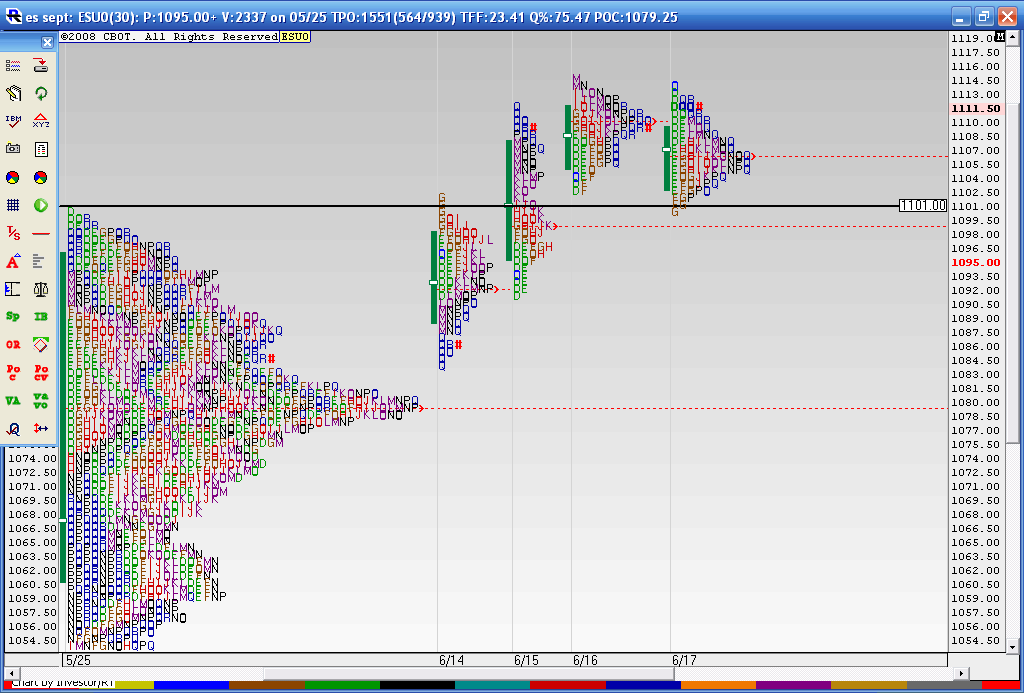
Here is a follow up to a chart I posted. I just don't remember where I posted it..Anyway this shows the Breakout on Monday 6-14 of the composite profile at 1101 and the fact that they held above the big composite node of 1079 - 1080 . Then we went up two more days on 6-15 and 6-16 and today was the first time we had lower price highs and lower Value ( solid green line to the left of the letters). The last three days all have overlapping Value. So we are coiled up and ready to trade for breakouts on Friday.
I also made note of the "bunching " together of the letters in my previous post thinking that a high was in. So I was wrong on that along with all the other cycle folks and market gurus. If this breakout starts to fail then we need to keep a close eye on the breakout point 1101 and of course that high volume node of 1079- 1180. The breakout point was tested today on Thursday and closed just off it's highs. These longer term profiles and my analysis is a work in progress so hopefully this journey will point out some good clues over time. Many are noticing the weakness in Volume and market internals since the breakout of 1101 so that needs to be factored in as we want to know "just how well" we are trending higher. So far I'd have to say not very well!!
I also made note of the "bunching " together of the letters in my previous post thinking that a high was in. So I was wrong on that along with all the other cycle folks and market gurus. If this breakout starts to fail then we need to keep a close eye on the breakout point 1101 and of course that high volume node of 1079- 1180. The breakout point was tested today on Thursday and closed just off it's highs. These longer term profiles and my analysis is a work in progress so hopefully this journey will point out some good clues over time. Many are noticing the weakness in Volume and market internals since the breakout of 1101 so that needs to be factored in as we want to know "just how well" we are trending higher. So far I'd have to say not very well!!
Click image for original size
here is how we are looking on Tuesday Afternoon...the test came today of our key 1101 number after creating an Outside bar on the daily chart on monday....so now many will be watching of we can close inside the 1101 number today..
Click image for original size
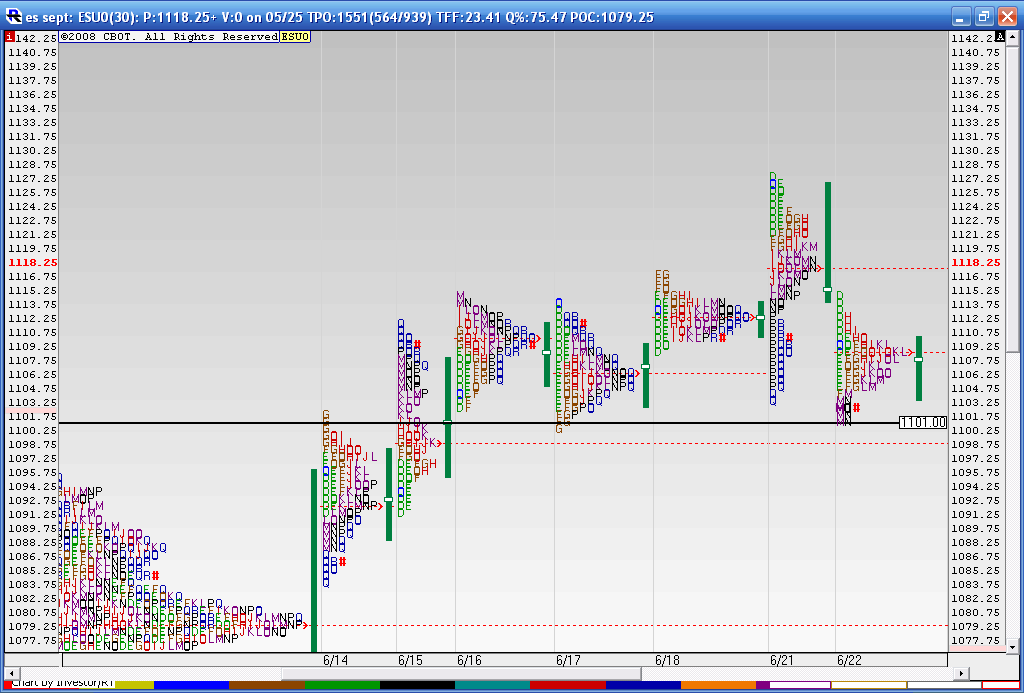
Here is how the day ended..closing well inside the key 1101 level...
Click image for original size

Here is how we are looking:
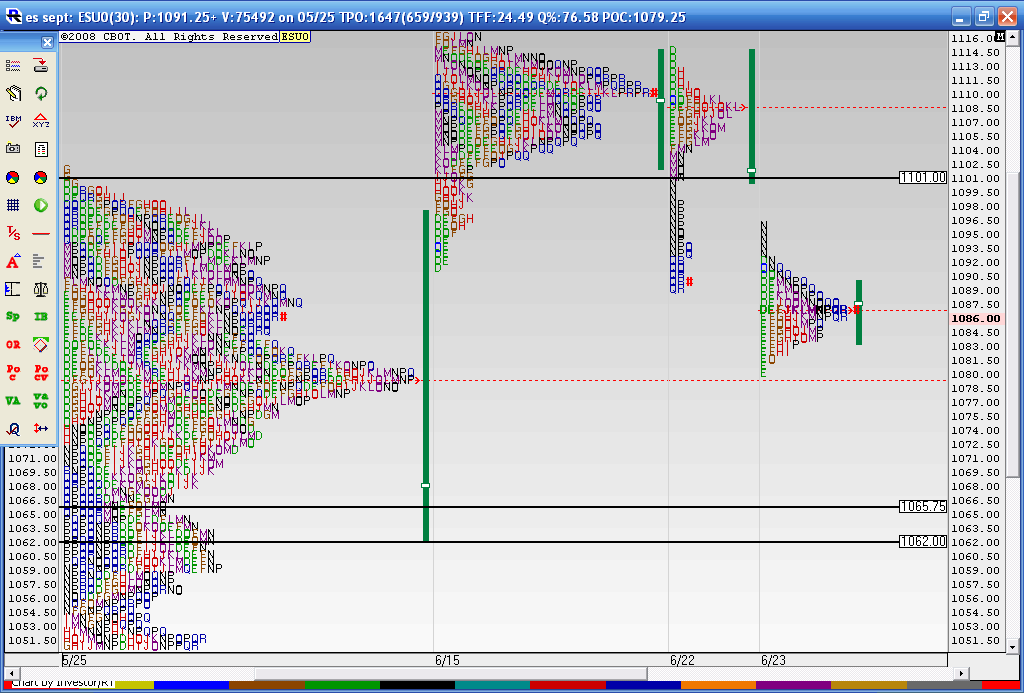
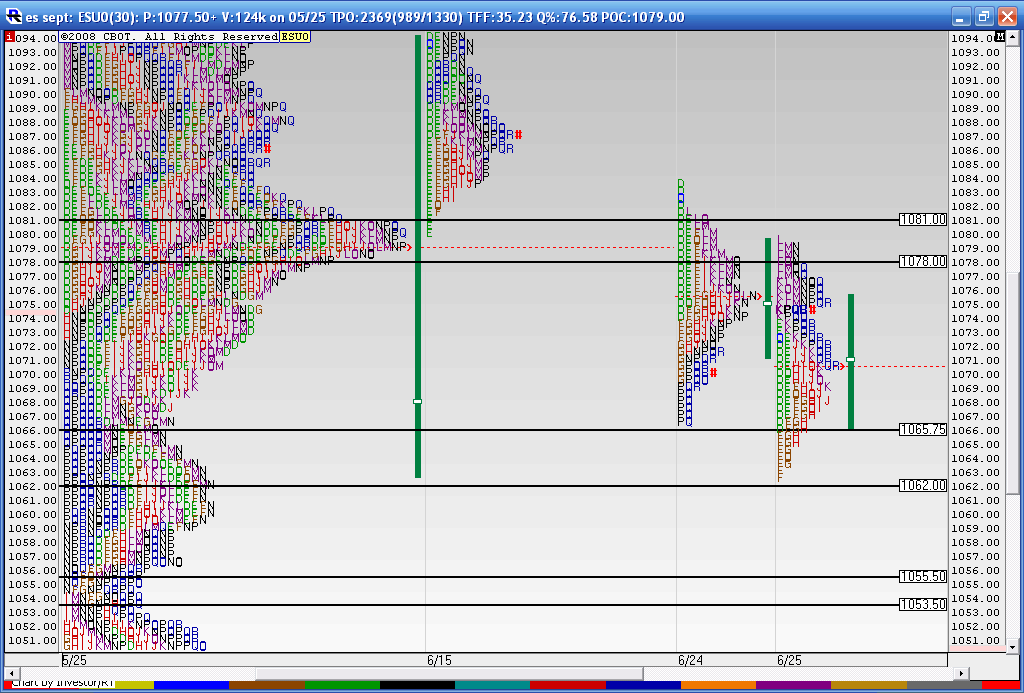
We had a close back inside the longer term Composite below 1101 and traded down into the peak composite price in the 78 - 81 range. That is the key price zone to decide the longer term picture....Today we had a consolidation day with the key price zone at 87- 89...above we have the 1101 and of course that 1108 area...
Below this 78 we have the 62 - 65 area as that is the VA low of the composite and a low volume area
Click image for original size
here how's we look at the end of Thursday....Market still working on that 78 - 81 zone...For friday the Va high from Thursdays Trade will be important resistance as it falls inside the zone....
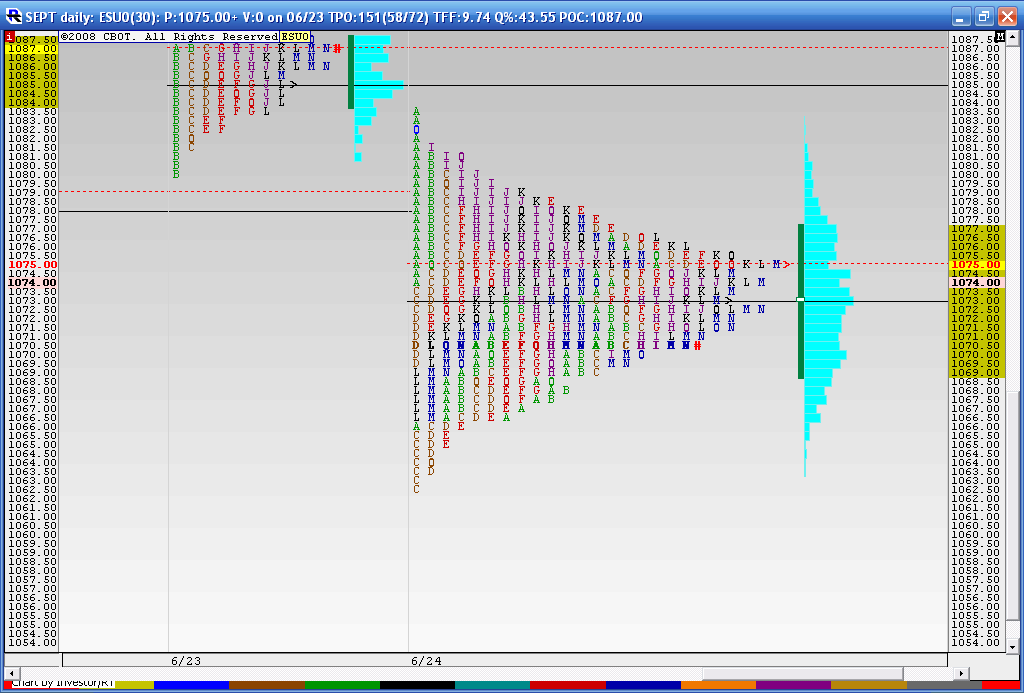
Came close into the 62 - 66 area today...below that is 53 - 55..don't like todays bottom as it doesn't show any impulse and a close closer to the lows...so that should get revisited soon..
Overnight trade will help point the way
Other keys that are showing up are the 87.50 - 89, 95 - 97 and of course the 1101 and the 1108 - 1110
Click image for original size
Encouraging for the bulls perhaps...here is friday's trade included in the big picture... all numbers essentially stay the same as our Key highs and lows were hit today...
Click image for original size
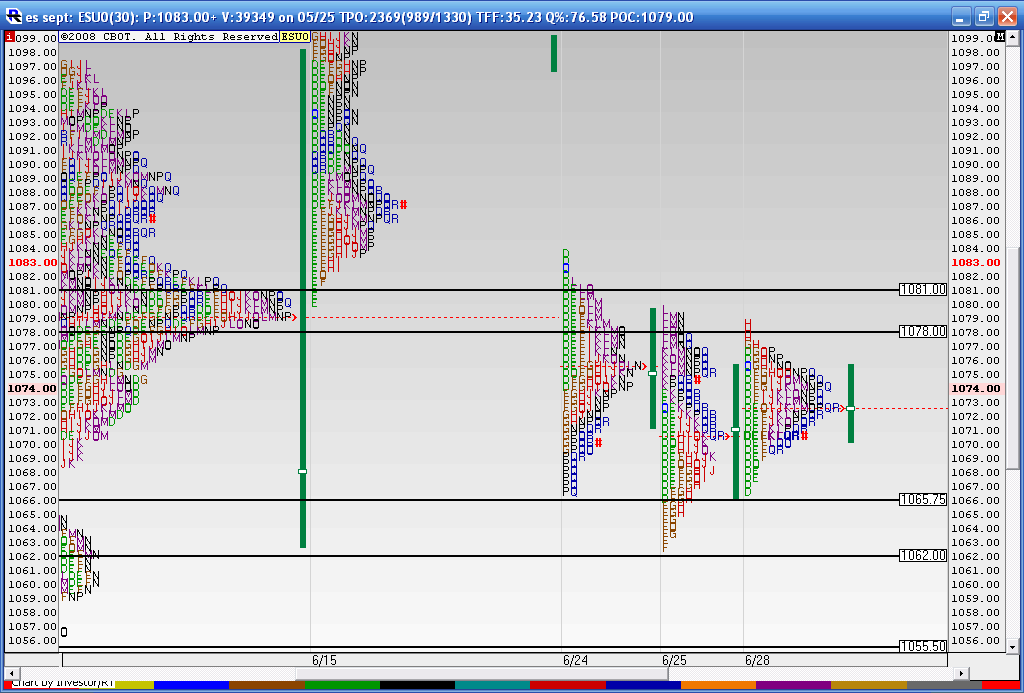
here is thursday, Friday and Monday merged together...we need to be on our guard now as this is very symetric and the VA is in the center...good chance Tuesday will establish new Value and break out from here...making it harder for fades from these outer levels..
Not boasting but I took an O/N trade off the 69 area...u can read it at the ES threads but now you know why 69 was a key number for me...Look at the Value area of this composite..!!
Not boasting but I took an O/N trade off the 69 area...u can read it at the ES threads but now you know why 69 was a key number for me...Look at the Value area of this composite..!!
Click image for original size
here is a slightly bigger view for reference...all numbers still in play..
Click image for original size
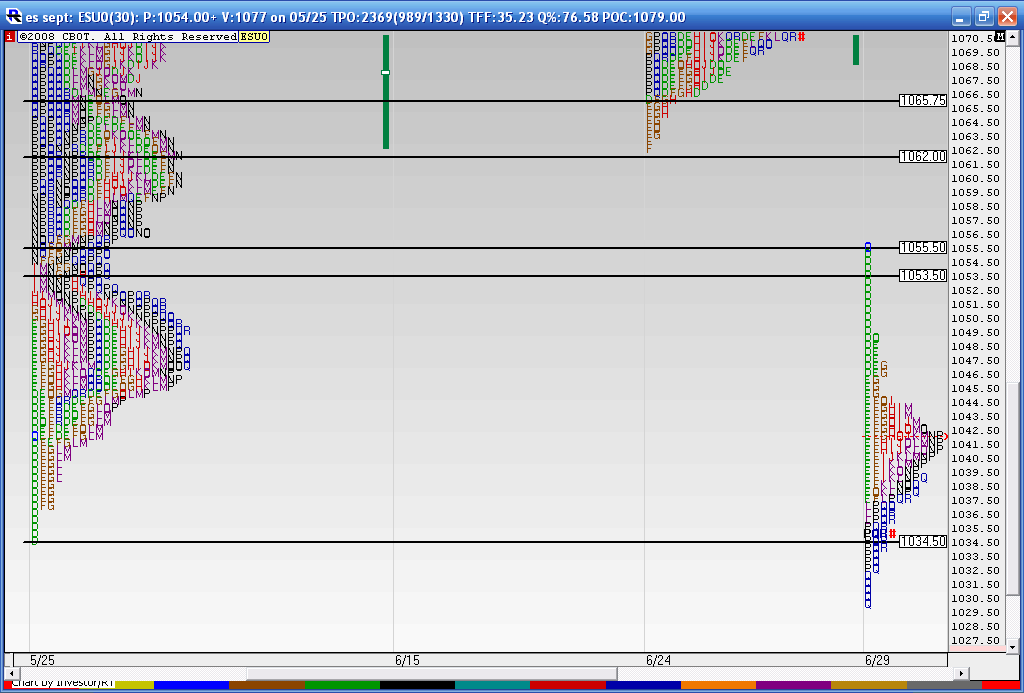
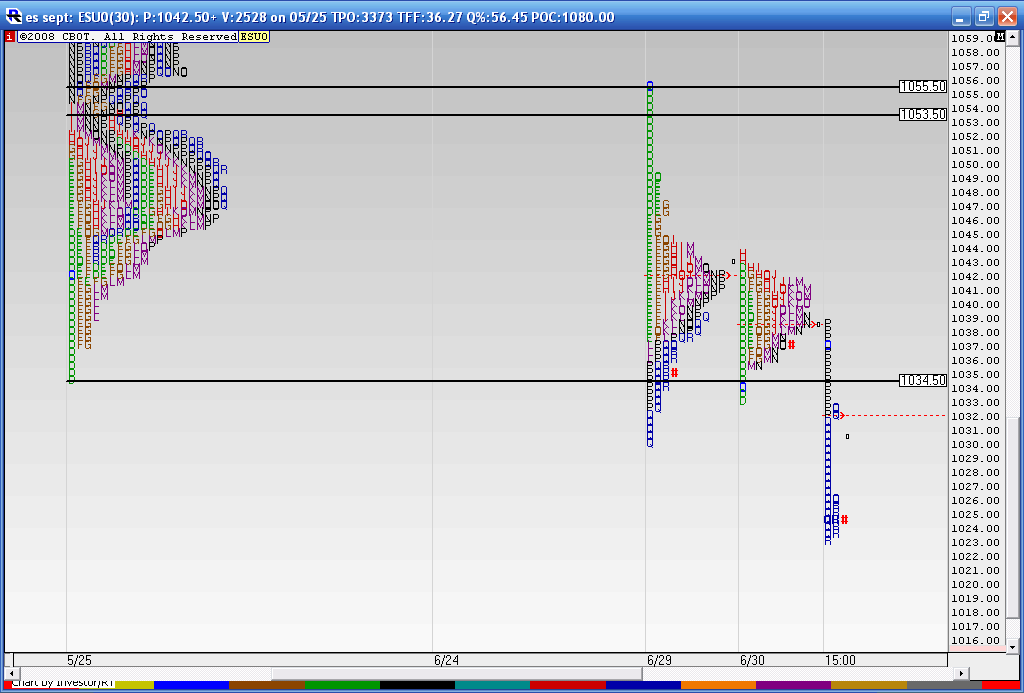
They broke it out overnight so unless you never sleep you aren't gonna get on that train....here is what happened Tuesday. We had the 53 - 55 zone on the chart's before....so we opened right there and broke the low of the longer term composite at 1034....that is now a critical low...if we can't spend much time below there they will run it back up into our old friend 1078 eventually...big air pocket between the 1055 and 1061 low......here is the chart...you decide...
Click image for original size
here is wednesday. We have the spike that broke out of developing value late in the day ( "P" period on my charts). Read Mind over Markets page 280 on...so we have a 16 point spike and where we open will affect how we trade it. An open in the spike you can use a range estimation of the spike. Watch what happens if we open above or below the spike and trade back into it for at least two 30 minute periods... that 39 area is not only the spike top but the POC..
Click image for original size
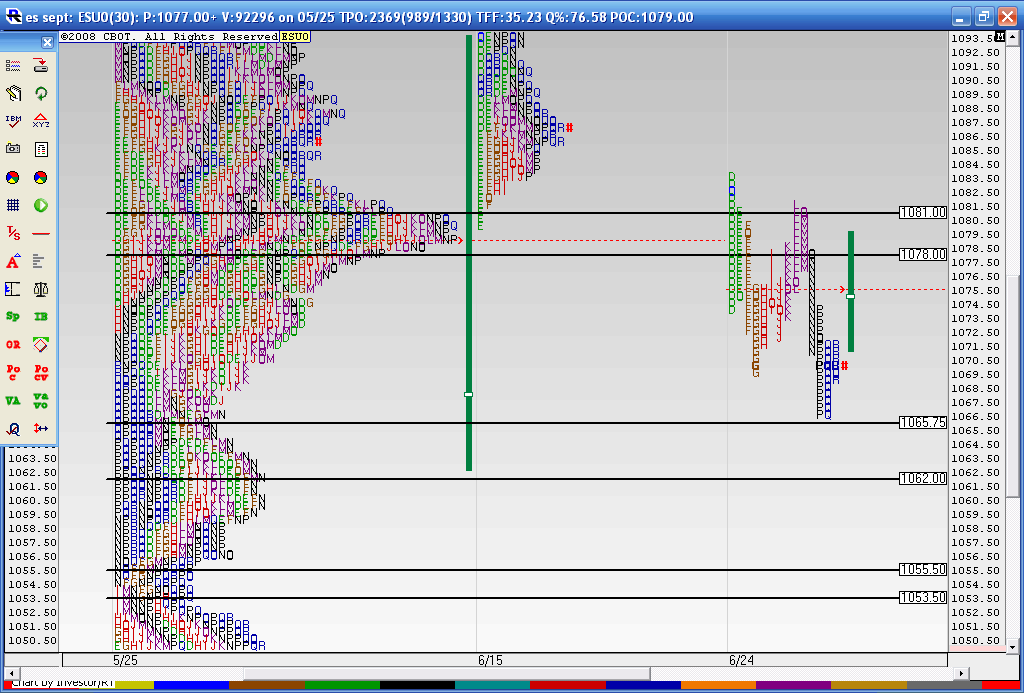
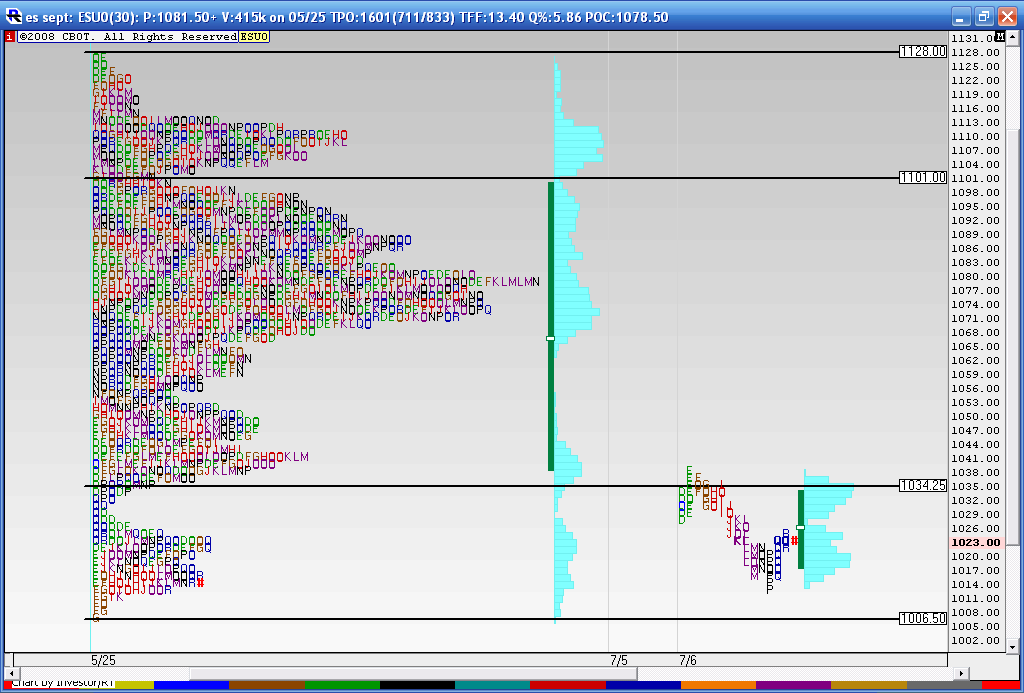
This gets interesting now if not curve fitted on my part. You may recall we had a consolidation bounded by the 1101 area on the upside and 1034 area on the downside. When we broke out of the 1101 on the upside we traveled approximately 27 points above the 1101 number before we rolled over and came out on the other side of the consolidation below 1034. We then traveled 27 points below the 1034 area to the 1006 area. Equal breakout moves...so far
Today we tested the 1034 area again. If we can hold todays lows we have a chance to get back to the midpoint of this trading range up above 1061 and higher to test all that volume in the 71 - 80 area. This chart had to be scaled to fit on the screen.
Today we tested the 1034 area again. If we can hold todays lows we have a chance to get back to the midpoint of this trading range up above 1061 and higher to test all that volume in the 71 - 80 area. This chart had to be scaled to fit on the screen.
Click image for original size
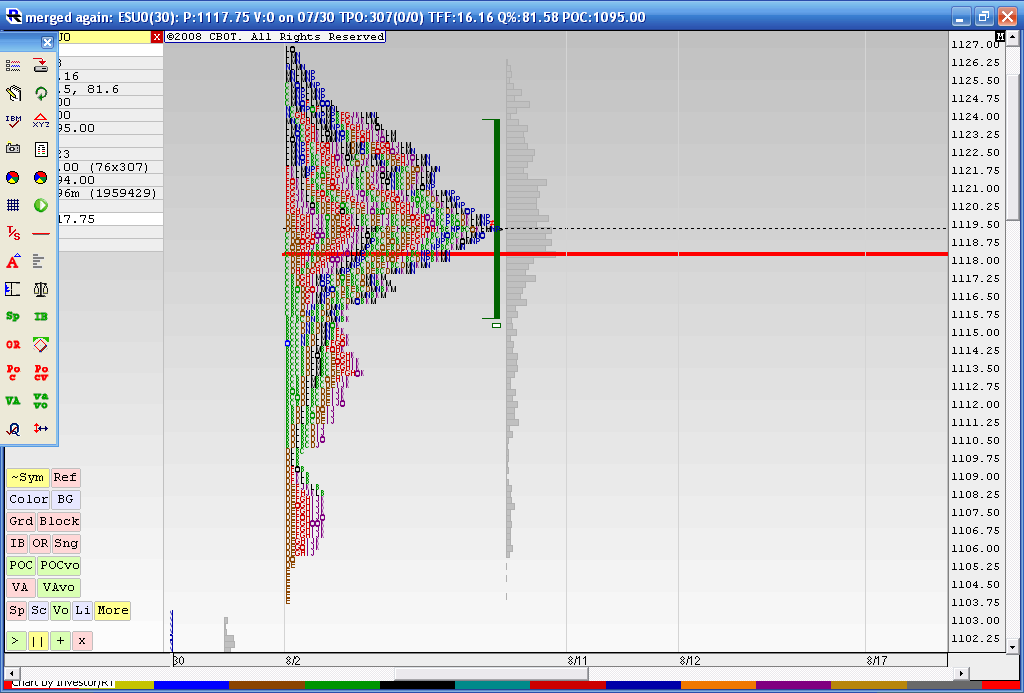
a look at what is trying to hold us back as we travel higher...this is the merged profile from 8-02 thru 8-10
Click image for original size
Emini Day Trading /
Daily Notes /
Forecast /
Economic Events /
Search /
Terms and Conditions /
Disclaimer /
Books /
Online Books /
Site Map /
Contact /
Privacy Policy /
Links /
About /
Day Trading Forum /
Investment Calculators /
Pivot Point Calculator /
Market Profile Generator /
Fibonacci Calculator /
Mailing List /
Advertise Here /
Articles /
Financial Terms /
Brokers /
Software /
Holidays /
Stock Split Calendar /
Mortgage Calculator /
Donate
Copyright © 2004-2023, MyPivots. All rights reserved.
Copyright © 2004-2023, MyPivots. All rights reserved.