ES Short Term Trading 6-23-10
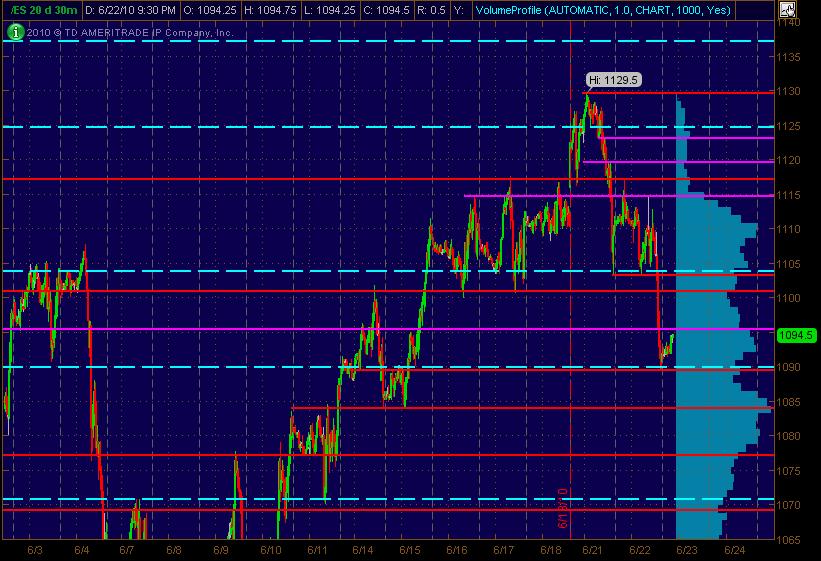
Here's what I've got as a Price Action S/R "MAP" ... the Red lines are potential significant S/R levels with Magenta semi-significant. The Cyan dashed lines are the Wkly Pivot levels. The Light Blue bars on the right vertical side of the chart represent Volume at Price on this 30-minute, 20 day chart:
Hope this is helpful to all ... and definitely follow MP analysis and your own analysis where things may line up and add significance at price levels for getting off a decent risk/reward trade.
And don't forget ... Wednesday is FOMC day ... stands for F*@K(ng Overall Massive Catastrophe for ____________ (fill in blank with your favorite pet peeve)!
Click image for original size
Hope this is helpful to all ... and definitely follow MP analysis and your own analysis where things may line up and add significance at price levels for getting off a decent risk/reward trade.
And don't forget ... Wednesday is FOMC day ... stands for F*@K(ng Overall Massive Catastrophe for ____________ (fill in blank with your favorite pet peeve)!
Originally posted by phileo
long 1091.5
playing the open (in case anyone is yearning for a reason)
target 1094 this time. stop at 1090.5
stopped out b/e...
looks like easy money has been made
looks like easy money has been made
PPT getting whacked by HFT sell programs. Most of the FOMC breakout has been retraced. 1085 hvn will be a key level of defense for the bulls.
Talk about a roller coaster ride....
But euro is still hanging on to its gains above 1.23
That might be a good tell going forward.
Talk about a roller coaster ride....
But euro is still hanging on to its gains above 1.23
That might be a good tell going forward.
amazing...the 10 a'm reports created more volume on a one minute spike then the fed announcement...
87 - 89 get top billing from todays trade.......
87 - 89 get top billing from todays trade.......
Originally posted by hari
2:23 bought at 1085
2:31 sold at 1090.50
fastest 5.5 pts ever for me :)
Originally posted by phileo
Euro is in a buying panic!!
TICK at +1400 !!
what the heck did big Ben say ??
fastest 4pts I've made all year
Emini Day Trading /
Daily Notes /
Forecast /
Economic Events /
Search /
Terms and Conditions /
Disclaimer /
Books /
Online Books /
Site Map /
Contact /
Privacy Policy /
Links /
About /
Day Trading Forum /
Investment Calculators /
Pivot Point Calculator /
Market Profile Generator /
Fibonacci Calculator /
Mailing List /
Advertise Here /
Articles /
Financial Terms /
Brokers /
Software /
Holidays /
Stock Split Calendar /
Mortgage Calculator /
Donate
Copyright © 2004-2023, MyPivots. All rights reserved.
Copyright © 2004-2023, MyPivots. All rights reserved.