Low range bars
This will be quick and dirty to get started. It deals with low range bars as we got into that a bit today in the Es thread. For this example I am using the 15 minute bars. I suggest waiting 90 minutes or looking at specific volume spikes before attempting to utilize or incorporate the idea which is this:
Most of us have learned to look for low range daily and weekly bars. The mypivot sites posts NR 7 and NR4...see forum for definitions. So I was taught back in 1998 or so to look for low range bars on any timeframe. I think anything under 5 minutes if too agressive.
We are assuming that low range bars are implying one of two things :
1) trend exhaustion or
2) Trend pausing before resuming.
So we can use these low range bars to enter or exit. I mostly use them to gear stops on runner contracts if I can't find a good stop loss point. Which happens quite often..
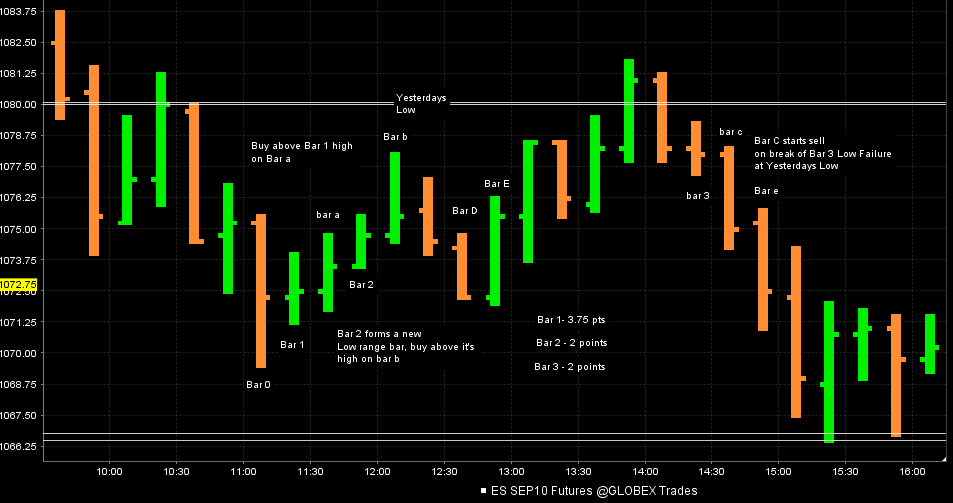
Here is todays chart:
1)Bar 0 makes a new low and a volume spike
2)Bar 1 is the lowest range of any 15 minute bar of the day.
(From this point on I am explaining how you could use them not specifically if or how I did in the ES thread - we spoke about the 5 minute low range bars for reference)
3) So we know that bar 1 will either imply a dry up of selling or a pause before selling off some more.
4)You could buy one tick above its high as Bar a begins. Now this is critical. It will take an OUTSIDE BAR ( OVB) to form with Bar a 's trading before you get stopped out at the other end of Bar 1. So Bar a could form an OVB to the downside and you could think about reversing to short if you are agressive. Or if bar a closes badly or inside bar 1 you may exit.
5) otherwise you are trying to target the distance of the bar . So if bar 1 is 3.75 points you want to try and get that far up off bar 1's high.
Think of the OVB concept ! It will take an OVB in the opposite direction of your entry to stop you out or a poor close
6 ) Bar 2 makes another low range bar even smaller than Bar 1
7) Buying the break of that achieves the profit objective for that bar and the bar 1 bar...Bar b hit the profit objectives
8) So we come down and break bar 2's low again on Bar D and we fail to achieve the profit objective....Bar E breaks above Bar 2's high and doesn't go back below the bar 2 low...so you would reverse long to the new profit objective.
9) After trying to get into yesterdays low we get another measley 2 point bar with bar 3. Bar "c" sends you short and we never go back above the bar 3 high..profit reached!
I know this chart is busy but just think about what if anything these low range bars MAY be telling us....
Is the market out of power to the upside or downside? Why are they forming where they are?
Look how bar E breaks bar 2's low again and no 15 minute bar ever trades back above bar two's high again....so no reversal to long or stop out..
I've posted most of the raw entries and certainly not suggesting anyone take all of them but put these low range bars in context and think about using them for stop losses....
Hopefully I haven't confused too many.....A basic concept and hopefully I have made it too complicated.....what does any contraction of range imply? How many times would you stop and reverse before you get a good entry..? I suggest 3 times maximum if you are agressive.
Use the range bars in market context and at your pre-defined S/R levels
How often do OVB's form after Low range bars on the 15 minute or whatever time frame you use?
Most of us have learned to look for low range daily and weekly bars. The mypivot sites posts NR 7 and NR4...see forum for definitions. So I was taught back in 1998 or so to look for low range bars on any timeframe. I think anything under 5 minutes if too agressive.
We are assuming that low range bars are implying one of two things :
1) trend exhaustion or
2) Trend pausing before resuming.
So we can use these low range bars to enter or exit. I mostly use them to gear stops on runner contracts if I can't find a good stop loss point. Which happens quite often..
Here is todays chart:
1)Bar 0 makes a new low and a volume spike
2)Bar 1 is the lowest range of any 15 minute bar of the day.
(From this point on I am explaining how you could use them not specifically if or how I did in the ES thread - we spoke about the 5 minute low range bars for reference)
3) So we know that bar 1 will either imply a dry up of selling or a pause before selling off some more.
4)You could buy one tick above its high as Bar a begins. Now this is critical. It will take an OUTSIDE BAR ( OVB) to form with Bar a 's trading before you get stopped out at the other end of Bar 1. So Bar a could form an OVB to the downside and you could think about reversing to short if you are agressive. Or if bar a closes badly or inside bar 1 you may exit.
5) otherwise you are trying to target the distance of the bar . So if bar 1 is 3.75 points you want to try and get that far up off bar 1's high.
Think of the OVB concept ! It will take an OVB in the opposite direction of your entry to stop you out or a poor close
6 ) Bar 2 makes another low range bar even smaller than Bar 1
7) Buying the break of that achieves the profit objective for that bar and the bar 1 bar...Bar b hit the profit objectives
8) So we come down and break bar 2's low again on Bar D and we fail to achieve the profit objective....Bar E breaks above Bar 2's high and doesn't go back below the bar 2 low...so you would reverse long to the new profit objective.
9) After trying to get into yesterdays low we get another measley 2 point bar with bar 3. Bar "c" sends you short and we never go back above the bar 3 high..profit reached!
I know this chart is busy but just think about what if anything these low range bars MAY be telling us....
Is the market out of power to the upside or downside? Why are they forming where they are?
Look how bar E breaks bar 2's low again and no 15 minute bar ever trades back above bar two's high again....so no reversal to long or stop out..
I've posted most of the raw entries and certainly not suggesting anyone take all of them but put these low range bars in context and think about using them for stop losses....
Hopefully I haven't confused too many.....A basic concept and hopefully I have made it too complicated.....what does any contraction of range imply? How many times would you stop and reverse before you get a good entry..? I suggest 3 times maximum if you are agressive.
Use the range bars in market context and at your pre-defined S/R levels
How often do OVB's form after Low range bars on the 15 minute or whatever time frame you use?
Click image for original size
Great post Bruce! Small range bars on the 15 min are great setups, I trade'm & the Inside bars on the 15 min too. I think a lot of daytraders drill down to small time frames for scalps & overlook or aren't aware that 15 min bars give you a lot more bang for your buck. I think the 15 min setups have a better win rate than smaller time-frame patterns, ya just have to be patient & wait for them.
Bruce, Thanks a lot for taking the time to describe this setup in so much detail.
Glad u folks understood that...I was afraid I made it too busy so most would just overlook this thread...thanks for the good words...
Yah that was awesome, I wish I had a clue of what it meant to me LOL. I'm so ignorant....
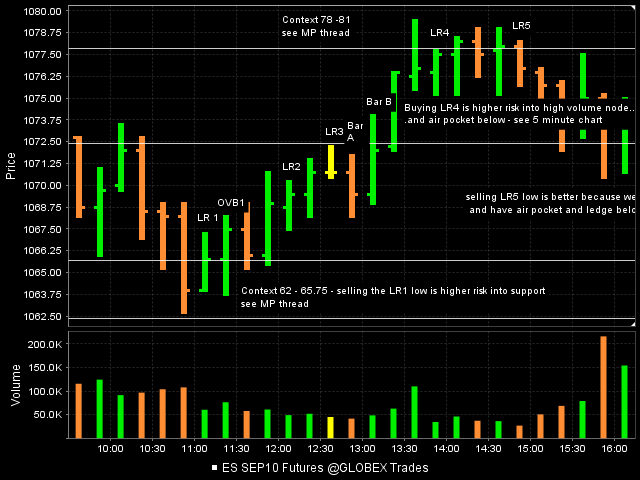
Here is today which luckily demonstrates a few points...specifically Context and the OVB ( Outside vertical bar).As usual I am not implying I took these specific trades.
1) 90 minutes are up so we can start looking for the lowest 15 minute bars and we head down into our predefined support zone of 62 - 65.75 as per my market profile thread.
2)We get the inside bar on LR1 ( Low range bar #1) after a volume spike into our zone ( Context !!)
3)We trade below the LR1 bar and then get an OVB to the upside....if you are trading just the pure signals without any discretion you would have been short and then reversed long above the LR1 high. Think about what a low range bar might mean ! A pause before a further decline or selling drying up. This was a fake out to the downside and when further selling didn't enter they rallied it above the LR1 high...
4) The next OBVIOUS low range bar is at LR 3. This was the new lowest range bar of the day right below the open print. If you look at your one minute data the LR3 high was inside the first one minute bars range. That is the opening range to many people..the first complete minute of trade.
5)So the bar after LR3 , Bar A , breaks it's low and the hits it's target.
6) Then Bar B breaks the LR3 high and hits it's target to the upside too.
7 ) We rally into the predefined 78 - 81 zone as posted in the my market profile thread.
8) There are quite a few narrow range bars up at those highs. Do we want to buy right into resistence? Probably not ! This is the same concept that happened on the lows....we don't want to sell into support hoping we can break though it...
9)If you blindly took the buy above LR 4 you would have reversed to short on LR5's break down...why? We have a ledge below and an air pocket and we are up at resistence ....Context!!!
10) The selloff that began on LR5 stops exactly at the lowest 15 minute bar of the day LR3...! Awewsome!! Look at the matching lows....
In the next post we will briefly look at the 5 minute as 15 minute bars are usually made up of at least one 5 minute low range bar ..If not more...
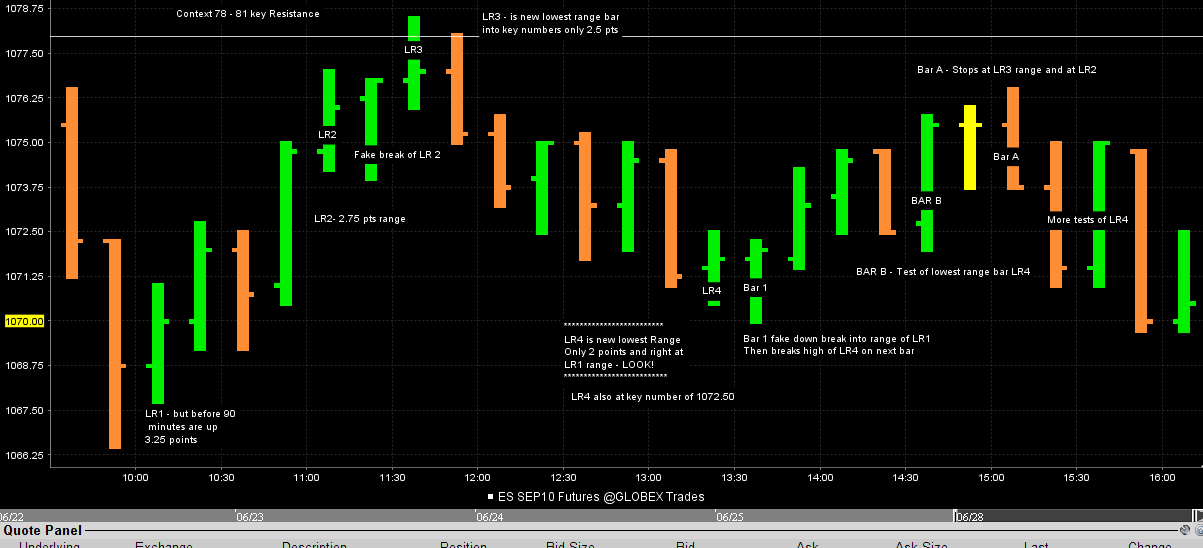
Here is the chart for this post...
1) 90 minutes are up so we can start looking for the lowest 15 minute bars and we head down into our predefined support zone of 62 - 65.75 as per my market profile thread.
2)We get the inside bar on LR1 ( Low range bar #1) after a volume spike into our zone ( Context !!)
3)We trade below the LR1 bar and then get an OVB to the upside....if you are trading just the pure signals without any discretion you would have been short and then reversed long above the LR1 high. Think about what a low range bar might mean ! A pause before a further decline or selling drying up. This was a fake out to the downside and when further selling didn't enter they rallied it above the LR1 high...
4) The next OBVIOUS low range bar is at LR 3. This was the new lowest range bar of the day right below the open print. If you look at your one minute data the LR3 high was inside the first one minute bars range. That is the opening range to many people..the first complete minute of trade.
5)So the bar after LR3 , Bar A , breaks it's low and the hits it's target.
6) Then Bar B breaks the LR3 high and hits it's target to the upside too.
7 ) We rally into the predefined 78 - 81 zone as posted in the my market profile thread.
8) There are quite a few narrow range bars up at those highs. Do we want to buy right into resistence? Probably not ! This is the same concept that happened on the lows....we don't want to sell into support hoping we can break though it...
9)If you blindly took the buy above LR 4 you would have reversed to short on LR5's break down...why? We have a ledge below and an air pocket and we are up at resistence ....Context!!!
10) The selloff that began on LR5 stops exactly at the lowest 15 minute bar of the day LR3...! Awewsome!! Look at the matching lows....
In the next post we will briefly look at the 5 minute as 15 minute bars are usually made up of at least one 5 minute low range bar ..If not more...
Here is the chart for this post...
Click image for original size
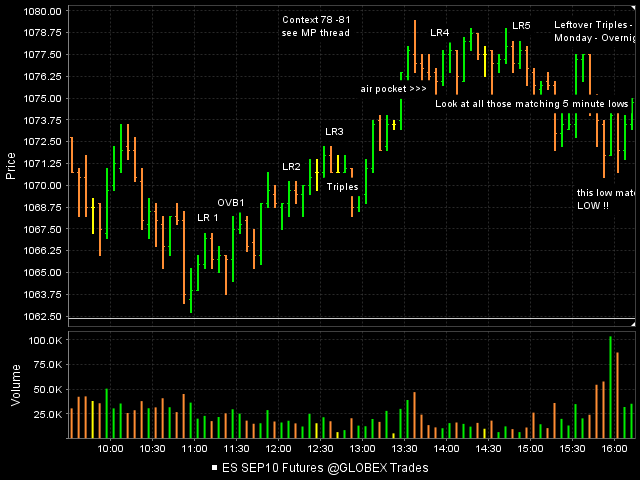
here is the same chart but at a 5 minute interval...the Low range 15 minute labels I kept in place so you can see what is happening at those areas on the 5 minute chart...please see this thread for possible entry bars at the swing low and high support and resistence zones....and how you might have reversed or taken a smaller loss when that OVB formed at the lows
http://www.mypivots.com/board/Topic/2078/1/your-favorite-entry-bars
http://www.mypivots.com/board/Topic/2078/1/your-favorite-entry-bars
Click image for original size
ask questions Chad...we're all in this together!!!
Originally posted by Skyfly
Yah that was awesome, I wish I had a clue of what it meant to me LOL. I'm so ignorant....
Right ok..ok, well is their something I could read up on about this? Maybe a paper perhaps?
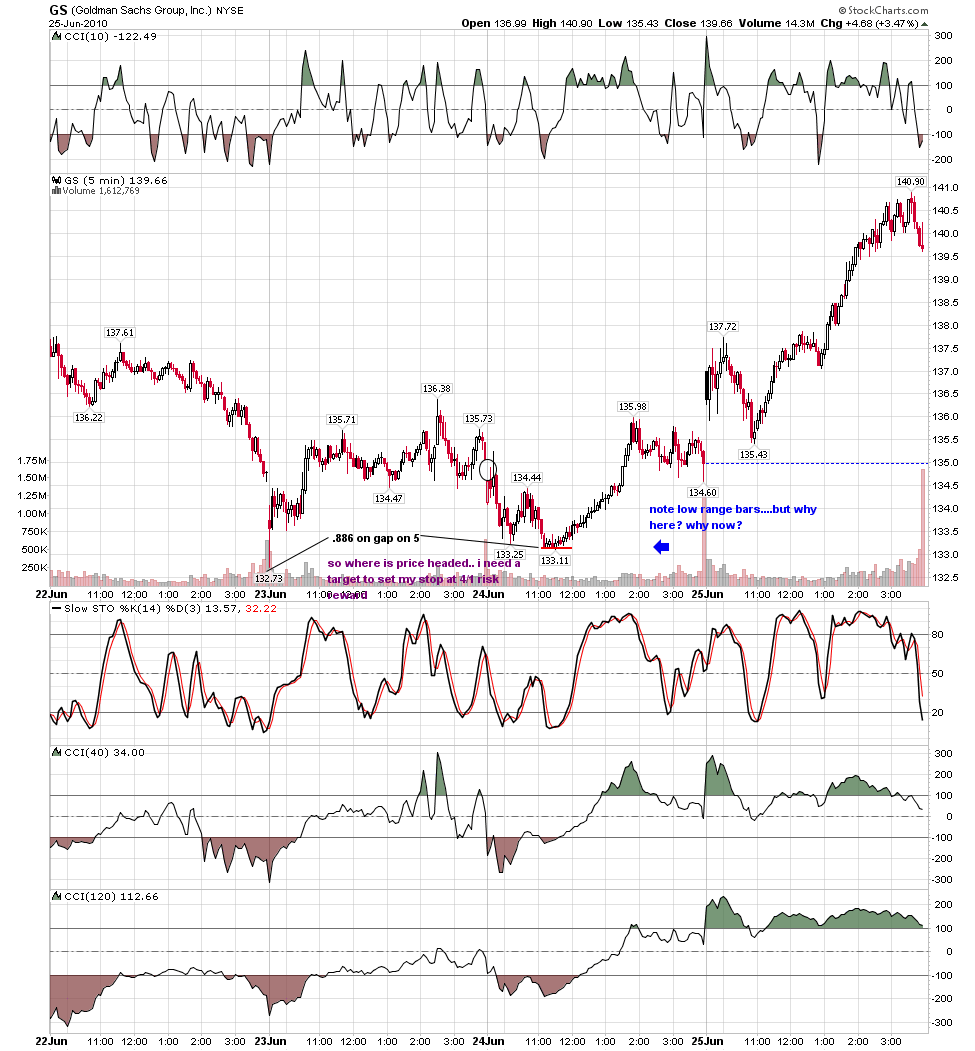
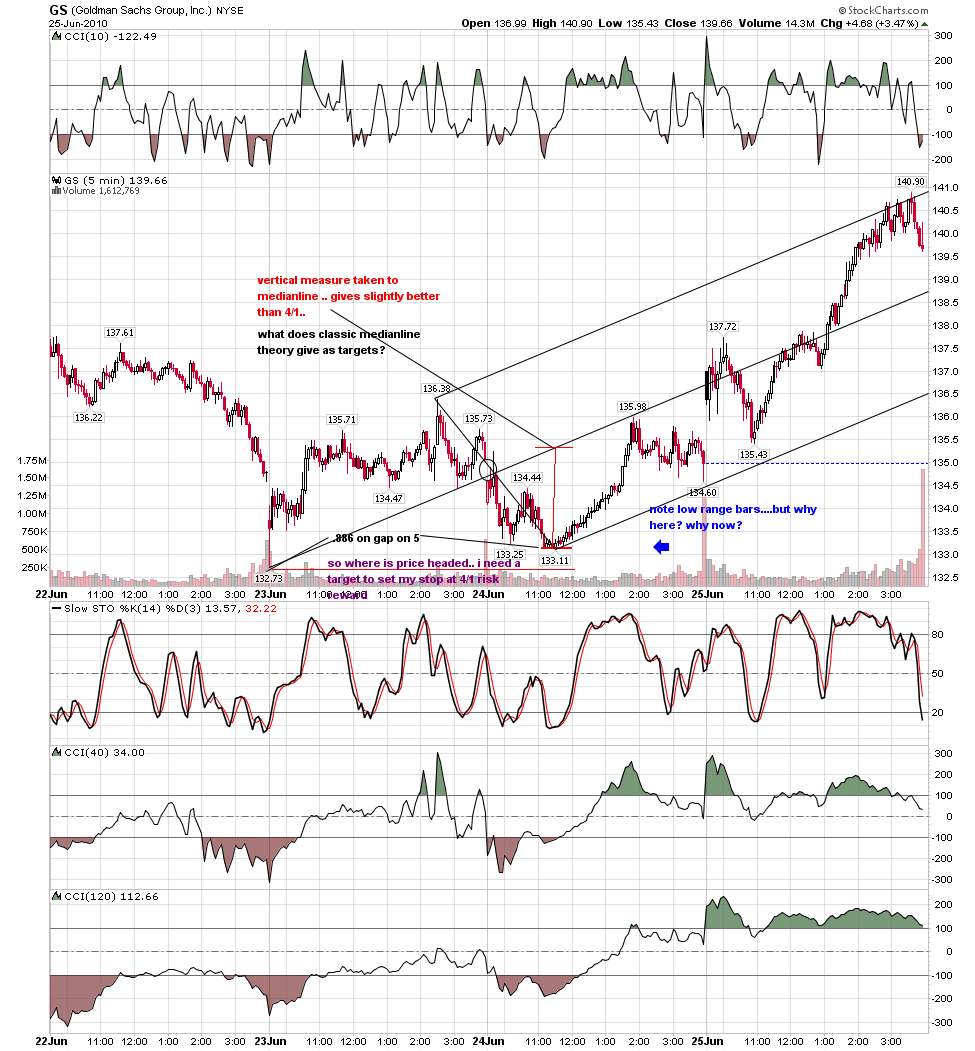
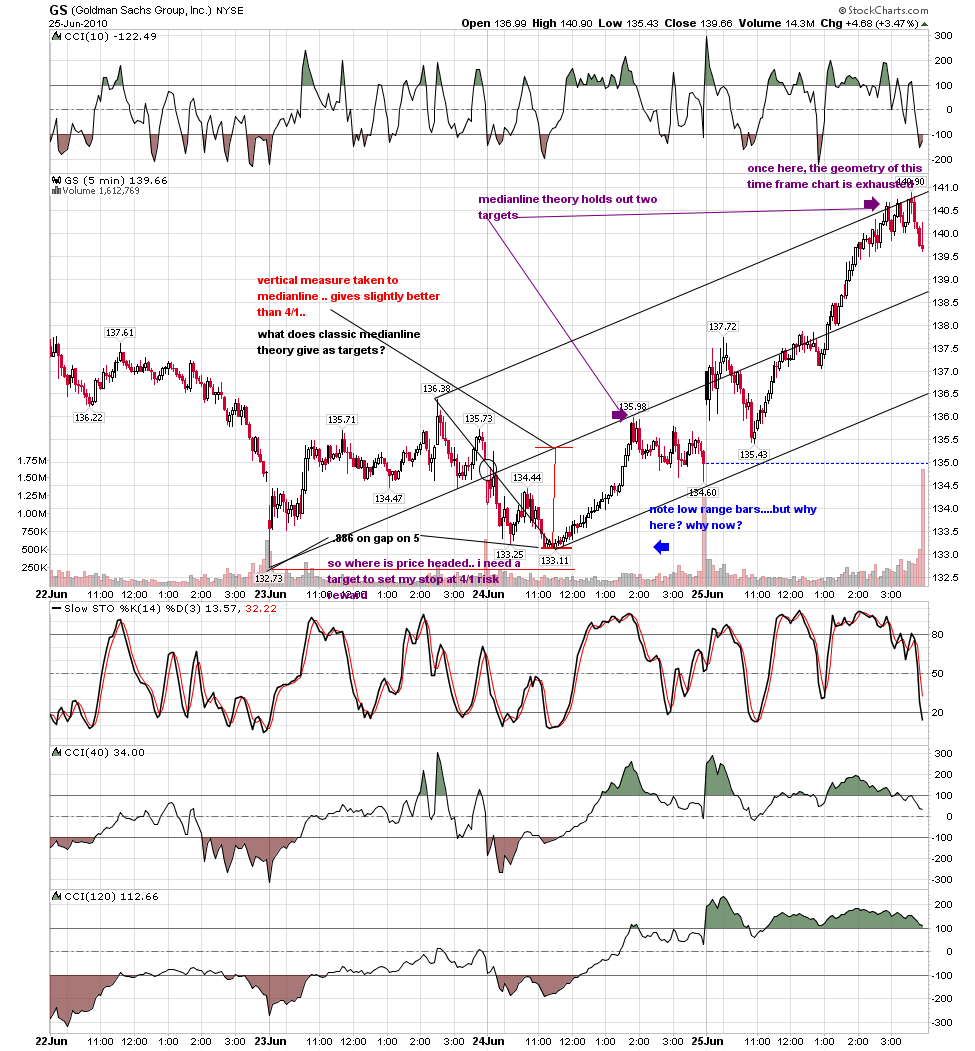
here is a recent trade in GS incorporating bruce's low range bars showing why the computers were already focused on that price level, how stop was set and eventual targets given by tools i have shown at this forum...please, if you find any value in this work, do not vote it up....
Click image for original size

Click image for original size
Click image for original size
Click image for original size
no papers that I know of but search here and the web for NR4 and NR7 and toby Crabel........idea behind low range bars in general is that they indicate a stall in the market...so we can trade breakouts from them...let me know if you have a specific question
Originally posted by Skyfly
Right ok..ok, well is their something I could read up on about this? Maybe a paper perhaps?
Last chart in this series as I think the concept is fairly direct...
we came into today with 78 - 81 again and the 72.50 number
we came into today with 78 - 81 again and the 72.50 number
Click image for original size
Emini Day Trading /
Daily Notes /
Forecast /
Economic Events /
Search /
Terms and Conditions /
Disclaimer /
Books /
Online Books /
Site Map /
Contact /
Privacy Policy /
Links /
About /
Day Trading Forum /
Investment Calculators /
Pivot Point Calculator /
Market Profile Generator /
Fibonacci Calculator /
Mailing List /
Advertise Here /
Articles /
Financial Terms /
Brokers /
Software /
Holidays /
Stock Split Calendar /
Mortgage Calculator /
Donate
Copyright © 2004-2023, MyPivots. All rights reserved.
Copyright © 2004-2023, MyPivots. All rights reserved.