ES short term trading 6-25-10
Here's the chart of what I'm seeing:
Here are the numbers I will be watching for potential trades:
1065.5 - 1066.5: Yesterday's Lo and O/N Lo
1069.5-70.5: Yesterday's VPOC and close
1075-76: daily PP, O/N hi, and POC
1079-1081: that hugh composite HVN, prior daily hi, and yesterday's swing hi
O/N action has been consolidating sideways, no bias, and trying to build a base around yesterday's close. Price is currently below yesterday's value area, which suggests looking for shorts near 1075. However, with 4 days of selling, we are overdue for a bounce. I will be looking for a rally in the afternoon.
Click image for original size
Here are the numbers I will be watching for potential trades:
1065.5 - 1066.5: Yesterday's Lo and O/N Lo
1069.5-70.5: Yesterday's VPOC and close
1075-76: daily PP, O/N hi, and POC
1079-1081: that hugh composite HVN, prior daily hi, and yesterday's swing hi
O/N action has been consolidating sideways, no bias, and trying to build a base around yesterday's close. Price is currently below yesterday's value area, which suggests looking for shorts near 1075. However, with 4 days of selling, we are overdue for a bounce. I will be looking for a rally in the afternoon.
Originally posted by phileo
long 1066.5
feel kinda nervous countertrend trading, but this is a test of O/N lows.
Looking for TICK to bounce +ve here or else i am out
Have to run my ex-wife (roommate) to work...back in a bit with my analysis...
Originally posted by phileo
Originally posted by phileo
long 1066.5
feel kinda nervous countertrend trading, but this is a test of O/N lows.
Looking for TICK to bounce +ve here or else i am out
huge reversal candle, but no +ve TICK extreme yet - that's when the big boys are really covering.
Originally posted by phileo
Originally posted by phileo
Originally posted by phileo
long 1066.5
feel kinda nervous countertrend trading, but this is a test of O/N lows.
Looking for TICK to bounce +ve here or else i am out
huge reversal candle, but no +ve TICK extreme yet - that's when the big boys are really covering.
stop to b/e, dropped 2pts on the sell sequence, need to see a 5min. close above 1071 or i am out
okay, got TICK +800, not quite the lvl i was looking for, but so far so good. Still neeed this 5min. candle to close above 71
Originally posted by phileo
Originally posted by phileo
long 1066.5
feel kinda nervous countertrend trading, but this is a test of O/N lows.
Looking for TICK to bounce +ve here or else i am out
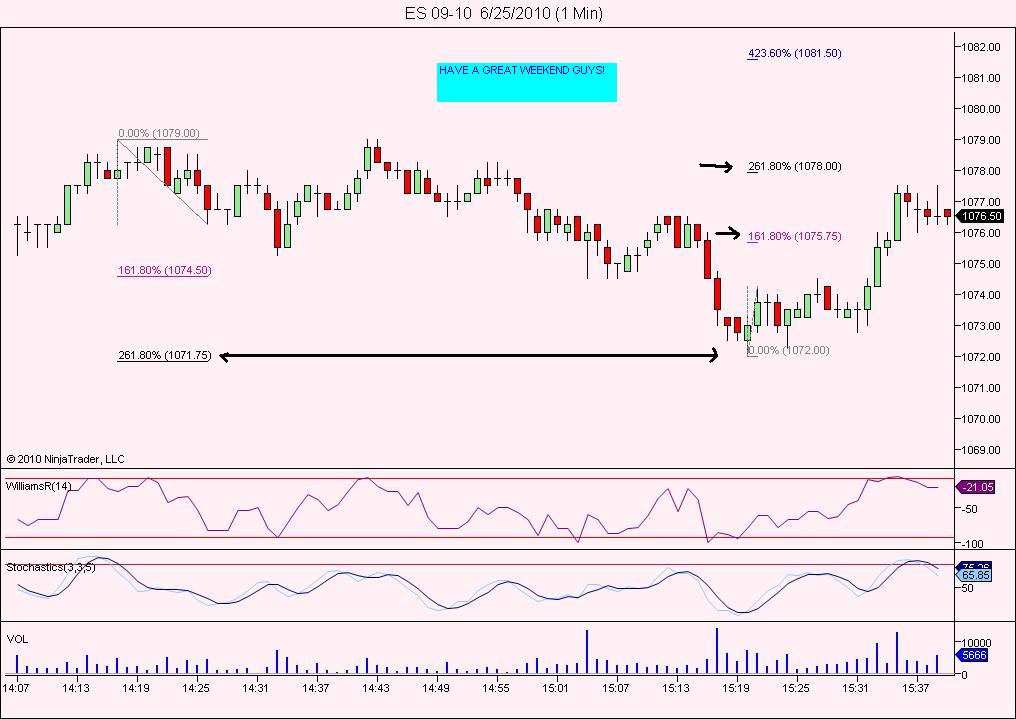
out 1071.75. +5.25, whoo-hoo!!!!!
I just got too nervous, couldn't stand it anymore. Plus we were getting close to the opening price (1072.5), and i knew that would bring out some trapped longs. Plus we are at the 7am reversal time.
11min. in that trade, but felt like an infinite eternity.....
Originally posted by PAUL9
Sure looks like the market is ready for a day of gains.
in phileo's 30min chart, descending trendline is obvious.
Potential reversal pattern that could take place has many names, all refer to same style PA (Trader Vic 1-2-3 bullish reversal pattern possible)
WHat could happen:
Price breaks above declining trendline, retraces alittle, stays above trendline and then goes UP past intermediate high.
O/N market has tipped hand for the signficance Support at 65 and resistance at 75.
75 also critical as most recent resistance obvious in 5 min 24hour prices. there have been 3 earnest attempts to move above it, all thwarted. next attempt at 75 (if it happens) would be the 4th attempt to break resistance.
I have saying, 4 is the door it either opens up or closes down.
iniitial break has to get past 75 and then find buying support in 75 area.
Not interested in losing my profits today, so the scenario you highlighted would be the only scenario where I would take another trade again.
for those who bother to calculate 5 day average of H versus Open and L versus Open.
I have noticed on trend days (and reversal days) that quite often, if price moves (for this case I will use bullish scenario) if price RTH moves above the H v O before 11 am, it often can signal a positive bias for the rest of the day.
5 day average of H versus Open comes in today at 1075.35 (there's that 75 number again)
5 day average of L versus the open comes in at 1057.40
yesterday tyhere was a pattern in this measure that shows up occassionally (now that I know to look for it)... the 5 day average of H v Open calced to 1085.25 for yesterday. Yesterday, upside couldn't get above 1083.75, difference was 1.50 points.
5 day average of H v O and L v O is just a way of dividing average range, so, if H for the day was 1.5 less than the 5 day average of the H v O, then that can be (I'm trying it) additional push for downside.
yesterday, 5 day average of L v O was for print 1068.15, but since H v O yesterday missed 1085.25 by 1.50, I extended the range expectation of L v O lower...
subtrat 1.50 from 5 day average of L v O (yesterday) which was
1068.15 - 1.50 = 1066.65.
actual L of the RTH session yesterday was 1066.50
air pocket 1065.25
not looking good for the bulls, as the bonds are rallying now...
not looking good for the bulls, as the bonds are rallying now...
Originally posted by phileo
air pocket 1065.25
not looking good for the bulls, as the bonds are rallying now...
air pocket filled. now hovering around the O/N lows.
Click image for original size
Emini Day Trading /
Daily Notes /
Forecast /
Economic Events /
Search /
Terms and Conditions /
Disclaimer /
Books /
Online Books /
Site Map /
Contact /
Privacy Policy /
Links /
About /
Day Trading Forum /
Investment Calculators /
Pivot Point Calculator /
Market Profile Generator /
Fibonacci Calculator /
Mailing List /
Advertise Here /
Articles /
Financial Terms /
Brokers /
Software /
Holidays /
Stock Split Calendar /
Mortgage Calculator /
Donate
Copyright © 2004-2023, MyPivots. All rights reserved.
Copyright © 2004-2023, MyPivots. All rights reserved.