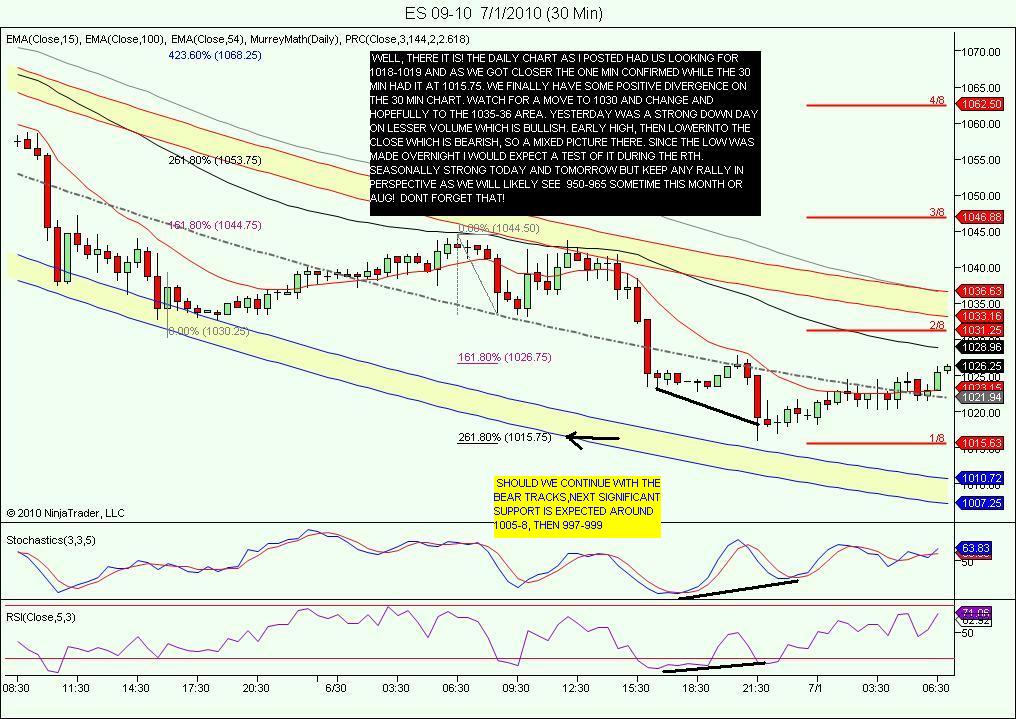
ES short term trading 7-1-10
Click image for original size
Hey Paul..that WOULD have been second 30 minute air posket...so it naturally filled...
phileo,
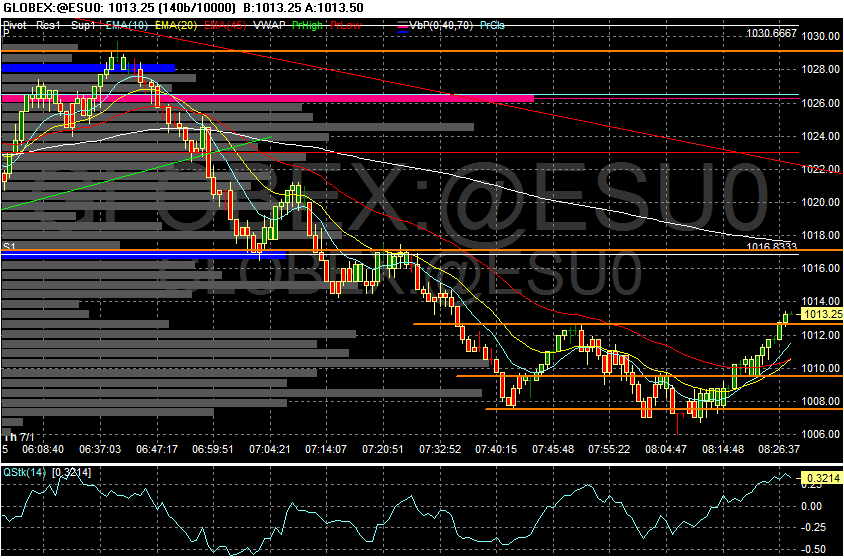
I'm looking at 1 min ES and $tick and at 11:08 am lpw price for ES, I see positive divergence in a hihger $tick than previous swing Low in price.
now price has exceeded prior swing H at 1013.00
if there is a retracement to 1009 handle that finds support, upside to 1017-1020 possible as shorts scramble.
high tick into that air may attract sellers again
Trade completed
Lost my connection about 1011. :)
Lost my connection about 1011. :)
Originally posted by phileo
something interesting that i noticed.
3 times i observed price move up from 1007 even while TICK was dropping below -900. That is a significant +ve divergence, indicating buyers are willing to absorb supply at that level.
Here's my theory:
Big money will pick a level where they are willing to absorb supply.
So during these massive selloffs, they need to pick a price level way below "fair value".
Click image for original size
Note the massive volume spikes at 1008.5 and 1010.5. Big money is willing to absorb supply there, so that is also "unfair value", ie. too much of a discount, so we should see a RALLY from those levels, if my theory is correct.
The first +ve TICK extreme all session just occurred at 1012, thus my theory is correct thus far. Let's see how this plays out.
Originally posted by PAUL9
phileo,
I'm looking at 1 min ES and $tick and at 11:08 am lpw price for ES, I see positive divergence in a hihger $tick than previous swing Low in price.
now price has exceeded prior swing H at 1013.00
if there is a retracement to 1009 handle that finds support, upside to 1017-1020 possible as shorts scramble.
Yeah, i saw that too, but the most interesting part for me was how price actually went up when TICK was dropping below -900. The only explanation for that is buyers are absorbing supply - and a massive amount of supply at that.
took one more at 16.25 print...
I understand, phileo, good observation.
bummer for me, was hoping for a retracement (roughly 50% of lift from 1007 to 1114), but it neve unfolded.
bummer for me, was hoping for a retracement (roughly 50% of lift from 1007 to 1114), but it neve unfolded.
Testing 1017 right about now (S1=1016.75), but 1012 needs to hold in order for this rally to continue.
bonds are testing a prior support level, and the Euro is consolidating at the top end of a significant resistance zone (it actually rallied while ES was selling off), so things are looking good so far for this rally from 1007. I think a good target for this rally would be the gap fill 1024.5
opening price = 1026
session hi = 1029.75
Originally posted by koolblue... LOOKED FOR 1030.50 (MISSED BY 3 TICKS) hell, i was sleeping anyway!... BUT A BINGO O/N THE DOWNSIDE....
Click image for original size
Thanks Nigel, I missed that from the chart:
@koolblue - you have plenty of silent followers. Keep posting!
Also, look at your reputation on the Members List - as I type this you are the second most voted for trader on this site which means that other traders here think that what you are posting is high quality.
last post, going to keep trading not posting... no one pays it much mind anyway! good luck gang!
@koolblue - you have plenty of silent followers. Keep posting!
Also, look at your reputation on the Members List - as I type this you are the second most voted for trader on this site which means that other traders here think that what you are posting is high quality.
Emini Day Trading /
Daily Notes /
Forecast /
Economic Events /
Search /
Terms and Conditions /
Disclaimer /
Books /
Online Books /
Site Map /
Contact /
Privacy Policy /
Links /
About /
Day Trading Forum /
Investment Calculators /
Pivot Point Calculator /
Market Profile Generator /
Fibonacci Calculator /
Mailing List /
Advertise Here /
Articles /
Financial Terms /
Brokers /
Software /
Holidays /
Stock Split Calendar /
Mortgage Calculator /
Donate
Copyright © 2004-2023, MyPivots. All rights reserved.
Copyright © 2004-2023, MyPivots. All rights reserved.