ES short term trading 7-2-10
here's a picture of the 30yr bonds:
There is a significant weekly VPOC and uptrend line providing the bonds w/ support.
ES will likely chop around sideways until this support in the bonds is broken. (30yr bonds and ES move inversely to each other)
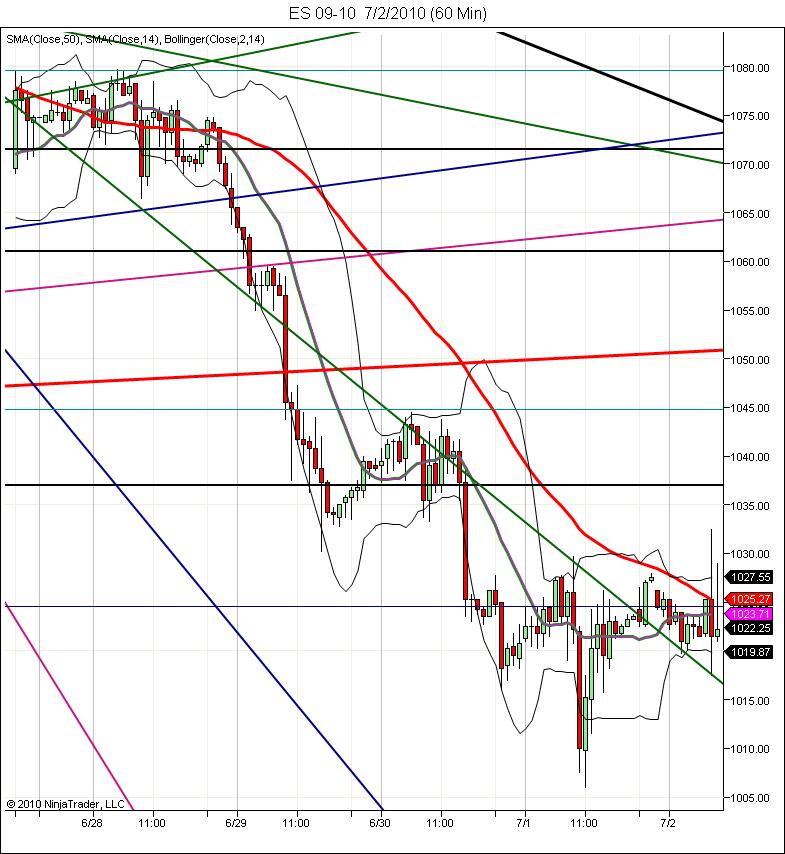
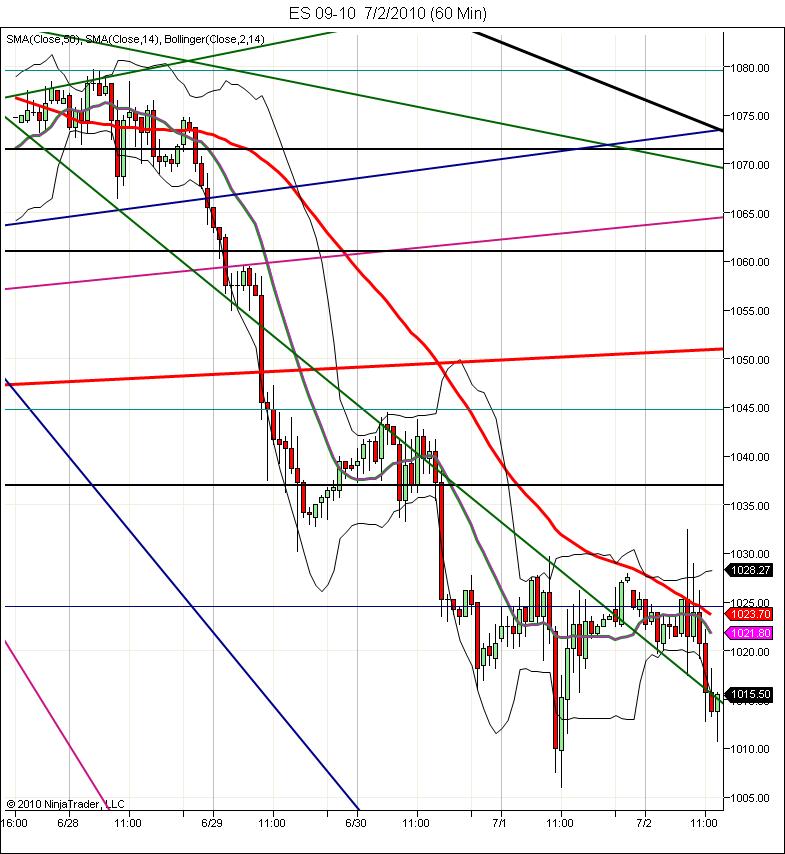
key numbers today for ES:
1030 - 1032: YDay's O/N hi and today's pre-NFP hi
1022 - gap fill (should be support at least initially)
1017-1018: signifiant support from yesterday's reaction
since we couldn't close above 1026 yesterday, the reversal action yesterday is suspect, and sellers will want to test that today.
Click image for original size
There is a significant weekly VPOC and uptrend line providing the bonds w/ support.
ES will likely chop around sideways until this support in the bonds is broken. (30yr bonds and ES move inversely to each other)
key numbers today for ES:
1030 - 1032: YDay's O/N hi and today's pre-NFP hi
1022 - gap fill (should be support at least initially)
1017-1018: signifiant support from yesterday's reaction
since we couldn't close above 1026 yesterday, the reversal action yesterday is suspect, and sellers will want to test that today.
Here's is the post that DavidS made in the other topic which I am going to remove:
Originally posted by DavidS
No thread today?
Sideways arch that will eventually melt down. Sideways ups and downs to trade. 1040 the target for longs should not be breached. Expect downtrend at end of this lift to start after 12:00 or next session.
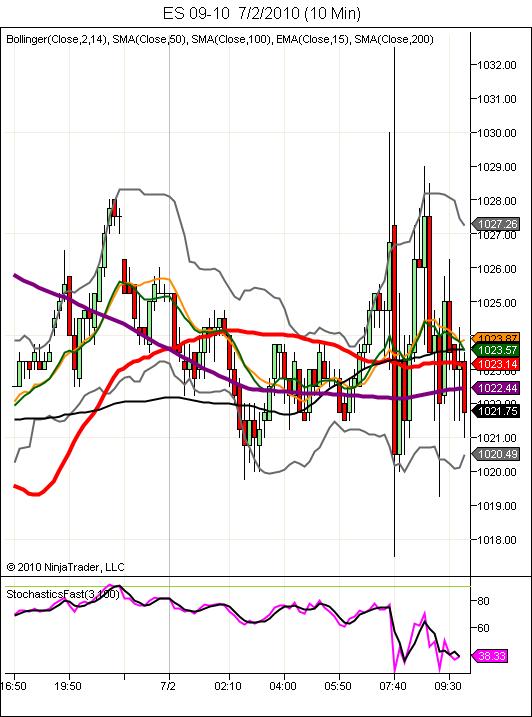
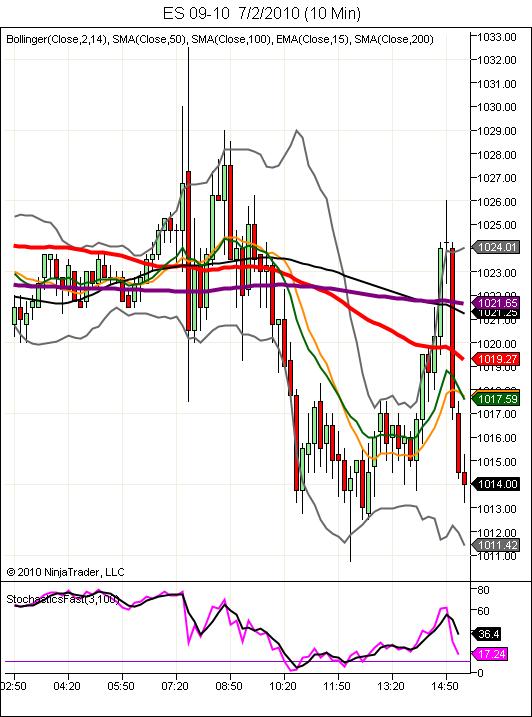
I trade on patterns and indicators. A 50 SMA on any time frame is quite useful tool. We're upwardly piecing the downtrending hourly 50 SMA. 1 minute SMA at 1025.5 .
Red downtrending line is 200 SMA.
Grey line sideways is the 50.
Click image for original size
looing for that crappy double bottom on es 5 minut eto get broken....29 was high Volume in O/N session
I use multiple timeframes(1,3,5,10, and 60 min) for trading. I also use Bollinger bands on all my charts.
I really don't predict but have an operating thesis in my head. We could go to 1050 today for all I know.
Note the flattened 50 SMA. Choppy trading. Can wreck you if you don't have a valid method. Below negative, above positive. Piercing or touching, possible reversal.
I really don't predict but have an operating thesis in my head. We could go to 1050 today for all I know.
Note the flattened 50 SMA. Choppy trading. Can wreck you if you don't have a valid method. Below negative, above positive. Piercing or touching, possible reversal.
Click image for original size
Hi Bruce I cant seem to post on the thread you last posted on. I saw nothing to get Kool annoyed. Let me add that I have followed Kool for some time now and he has a history of jumping from thread to thread and voice room to voice room for no know apparent reason. That said he has taught tons of valuable stuff and along with you, who I consider a focused, calm ,and a Master trader an unbeatable team. I hope he returns soon and that has been his mo in the past.
Missed out on shorting that failure to hold VWAP (break of 1024).
can't seem to pull the trigger on shorts for some reason today.
can't seem to pull the trigger on shorts for some reason today.
Originally posted by rburns
Hi Bruce I cant seem to post on the thread you last posted on...
The topic was locked which is why you couldn't post to it. BruceM has extra power on the forum which is why he could. The topic is deleted now so posting can continue on this topic.
Click image for original size
Market was trying to consolidate in the 1020 - 1025 area to establish value yesterday afternoon, and then again this morning.
However, the breakdown mid morning and subsequent rejection of 1018 does not bode well. Throughout the past 10/11 sessions, I have not seen the market accept previous day's higher VA.
If there is no rally to take us back into the 1020-1025 zone within the next couple of days, then lower prices are in the cards next week.
Technicals are oversold, but this means nothing until the market can establish what is fair value.
I spazzed out too and posted to the wrong thread......will copy them or give a quick summary of my one trade later only because the chart looked good for it
Originally posted by day trading
Originally posted by rburns
Hi Bruce I cant seem to post on the thread you last posted on...
The topic was locked which is why you couldn't post to it. BruceM has extra power on the forum which is why he could. The topic is deleted now so posting can continue on this topic.
Arch complete? Thinning traders the only thing positive here.
btw, thanks for the welcome Bruce. Happy 4th all.
btw, thanks for the welcome Bruce. Happy 4th all.
Click image for original size
here is a close up of the reasoning for my comments on the other thread.....market had tested and rejected the POC from the O/N at 1029......then we made a low...( double lows are crappy because they don't show impulse to get long....nobody in a rush to get long......compare the 29 high and the double bottom low......
So then I'm incorporating the key 24 area and the hour low concept and THEN triples were forming...right side of chart.....so short was the only way to add into
So then I'm incorporating the key 24 area and the hour low concept and THEN triples were forming...right side of chart.....so short was the only way to add into
Click image for original size

End of day. Note how the 50 ma was still downtrending in that lift. Note the piercing at the top of the bands.
I guess the larger timeframes are most important and I trade inside their context using the smaller timeframes. Like boats, always give the right of way to the larger vessel vessel that is slower to change course.
I guess the larger timeframes are most important and I trade inside their context using the smaller timeframes. Like boats, always give the right of way to the larger vessel vessel that is slower to change course.
Click image for original size
Emini Day Trading /
Daily Notes /
Forecast /
Economic Events /
Search /
Terms and Conditions /
Disclaimer /
Books /
Online Books /
Site Map /
Contact /
Privacy Policy /
Links /
About /
Day Trading Forum /
Investment Calculators /
Pivot Point Calculator /
Market Profile Generator /
Fibonacci Calculator /
Mailing List /
Advertise Here /
Articles /
Financial Terms /
Brokers /
Software /
Holidays /
Stock Split Calendar /
Mortgage Calculator /
Donate
Copyright © 2004-2023, MyPivots. All rights reserved.
Copyright © 2004-2023, MyPivots. All rights reserved.