Long term chart + EOD $TICK reading
Click image for original size
Click image for original size
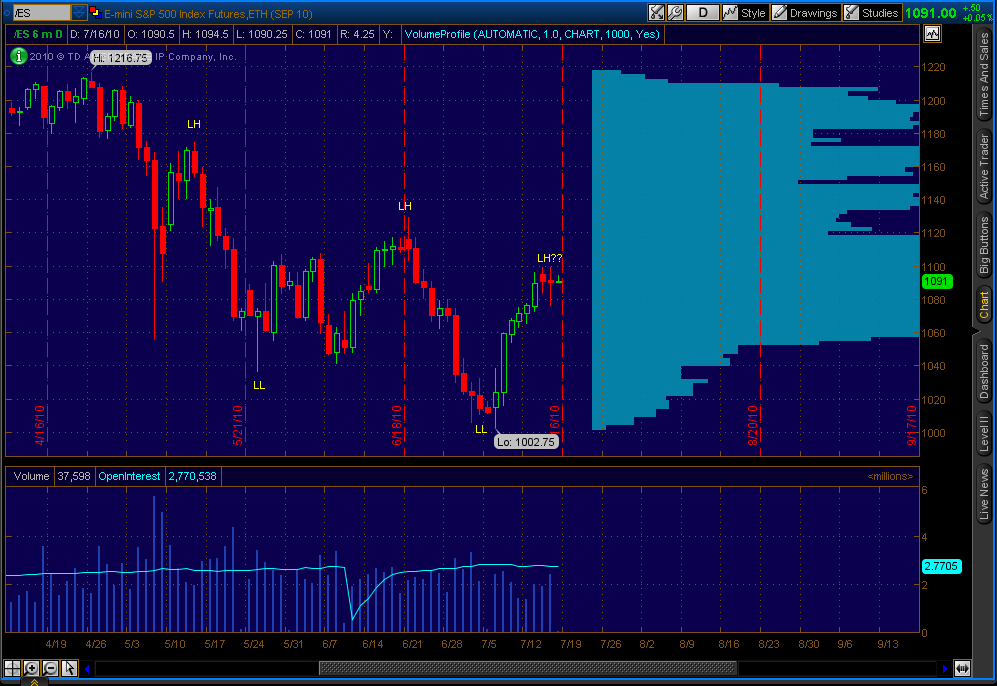
If we look at the 6 month chart we can see that we have been making LH's and LL's.
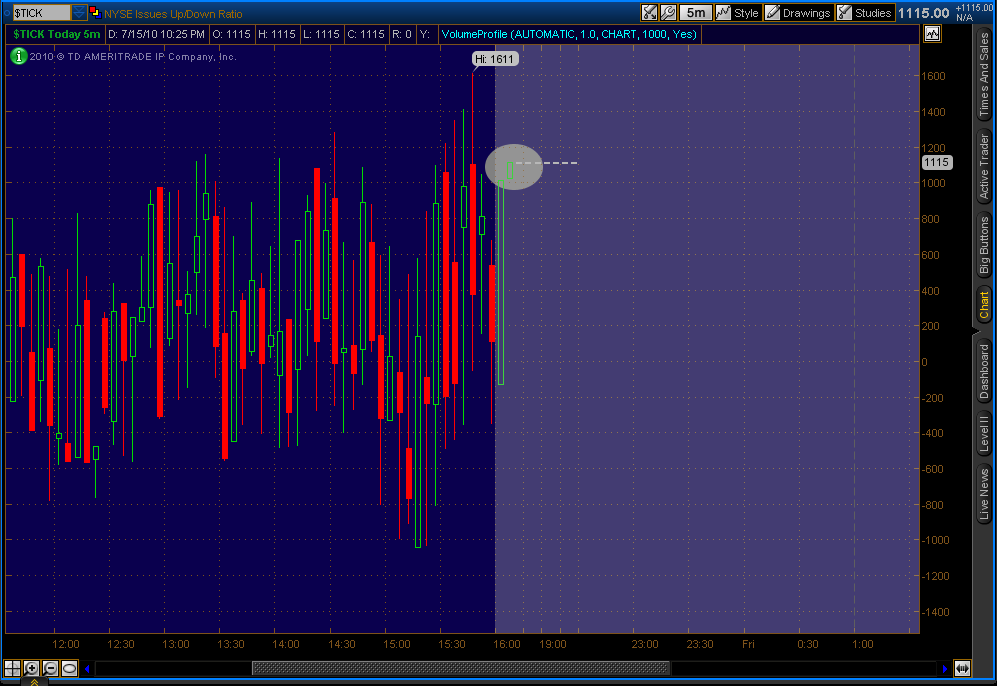
The recent run up we had from 7/6 leads me to believe that we have reached its top, forming another LH. Using Kool's price projection (he can confirm/negate this if I'm wrong) gives a projection to 1096.34. Actual high came in at 1099.25, pretty close. Also the $TICK from today closed around 1115 and I went back thru my notes because I remember someone, I don't know who but I believe it was Kool, said that if we had a high $TICK reading > 800 the following days were a sell off.
Just something to look at, what do you guys think?
ib has plus 676 on mondays close
+674 on TOS..
Emini Day Trading /
Daily Notes /
Forecast /
Economic Events /
Search /
Terms and Conditions /
Disclaimer /
Books /
Online Books /
Site Map /
Contact /
Privacy Policy /
Links /
About /
Day Trading Forum /
Investment Calculators /
Pivot Point Calculator /
Market Profile Generator /
Fibonacci Calculator /
Mailing List /
Advertise Here /
Articles /
Financial Terms /
Brokers /
Software /
Holidays /
Stock Split Calendar /
Mortgage Calculator /
Donate
Copyright © 2004-2023, MyPivots. All rights reserved.
Copyright © 2004-2023, MyPivots. All rights reserved.