ES short term trading 7-23-10
Upside numbers
1007 - 1009
1001
1095
1091 *****
Downside
1085
1080
73 - 76**********
62- 65
1007 - 1009
1001
1095
1091 *****
Downside
1085
1080
73 - 76**********
62- 65
Hey crew,
just wanted to drop by and let everyone know that i haven't disappeared or anything.
I've been trying to do a screencast today, but the freeware tool I am using screwed up and I lost the avi file. Frustrated, I haven't done any screencast again, will maybe try again monday.
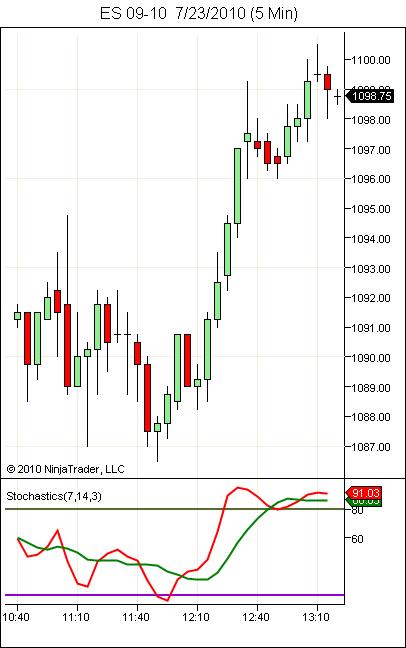
One other note, I hope no one is trying to fade this breakout. Above 1099 seems like a pretty fundamental and significant event to me, and we had a cluster of +1300 TICK extremes (ie. many, many of them!) to go with that. That's some significant buying (almost as if every fund manager and their grandma's pet dog are in a buy panic). I don't think it's high probability to fade this move anymore.
just wanted to drop by and let everyone know that i haven't disappeared or anything.
I've been trying to do a screencast today, but the freeware tool I am using screwed up and I lost the avi file. Frustrated, I haven't done any screencast again, will maybe try again monday.
One other note, I hope no one is trying to fade this breakout. Above 1099 seems like a pretty fundamental and significant event to me, and we had a cluster of +1300 TICK extremes (ie. many, many of them!) to go with that. That's some significant buying (almost as if every fund manager and their grandma's pet dog are in a buy panic). I don't think it's high probability to fade this move anymore.
Has anyone considered holding ES thru the weekend?
I'm toying with that idea if ES hold above 1099 going into the close.
That would force a lot of sellers to cover, and a potential gap up on Monday morning.....
FYI, Bonds are selling off into the pit close.
Any thoughts ?
I'm toying with that idea if ES hold above 1099 going into the close.
That would force a lot of sellers to cover, and a potential gap up on Monday morning.....
FYI, Bonds are selling off into the pit close.
Any thoughts ?
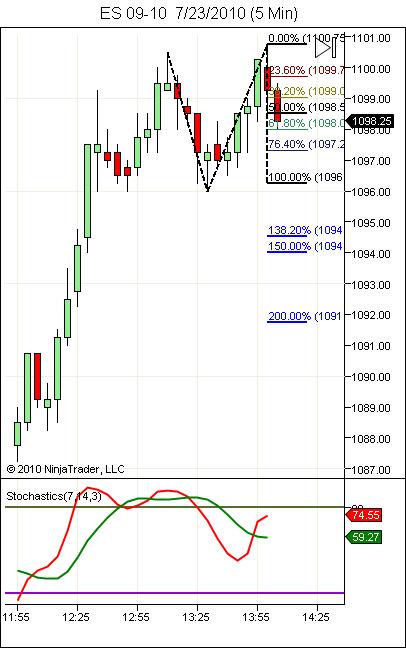
on second thought i think it's a normal 5 wave move up with either a correction or an extension due here.
Click image for original size
I'd personally rather miss than hold but everyone has their own risk level/tolerance.
Let's see if that top holds? 1100 has been the banana. Monkey usually trapped when they hold onto it.
Let's see if that top holds? 1100 has been the banana. Monkey usually trapped when they hold onto it.
Not being flippant with my opinions but they're as dynamic as the process. 2 days ago I was wondering if I'd ever see 1080 touched again in my lifetime? Just the way it is with me.
1001-1002.50 has some interesting numbers ...air at 95...and ledge at 96.50...
volume diverged ...we had more volume on the 12 noon bar than any bar since///
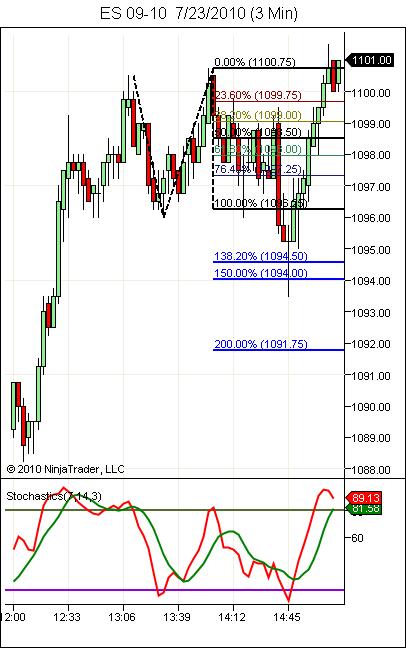
Click image for original size
1098.5 S/R 50% here
From the wave 5 top, a 3 wave correction, followed by the next 5 wave pattern up. Not blowin a horn(not in me), just fortunate to be able to evaluate as a thesis moves. There's always at least two choices. I try to minimize losses.
In that light, I apologize about the fact I had to bail as paying double or triple commission for multiple entries does't help the thought process here. I don't type fast and will be more limited posting. I hesitate to post just charts for it's leaves too much for individual interpretation in a moving market. I don't know how to type messages on my charts. Maybe I'll find out? Kudos to those that can post very frequently. I found my limitations doing it today.
As stated earlier, I pattern trade. I don't use volume. I use everything I can, but it's value has always eluded me. Just my take, or my limitation.
I hope this illuminated some of my method to you if you were interested.
We'll see what Monday brings? Have a good one!
Click image for original size
I wasn't around on Friday but I'd like to share some observations on the trading day after I've studied the action.
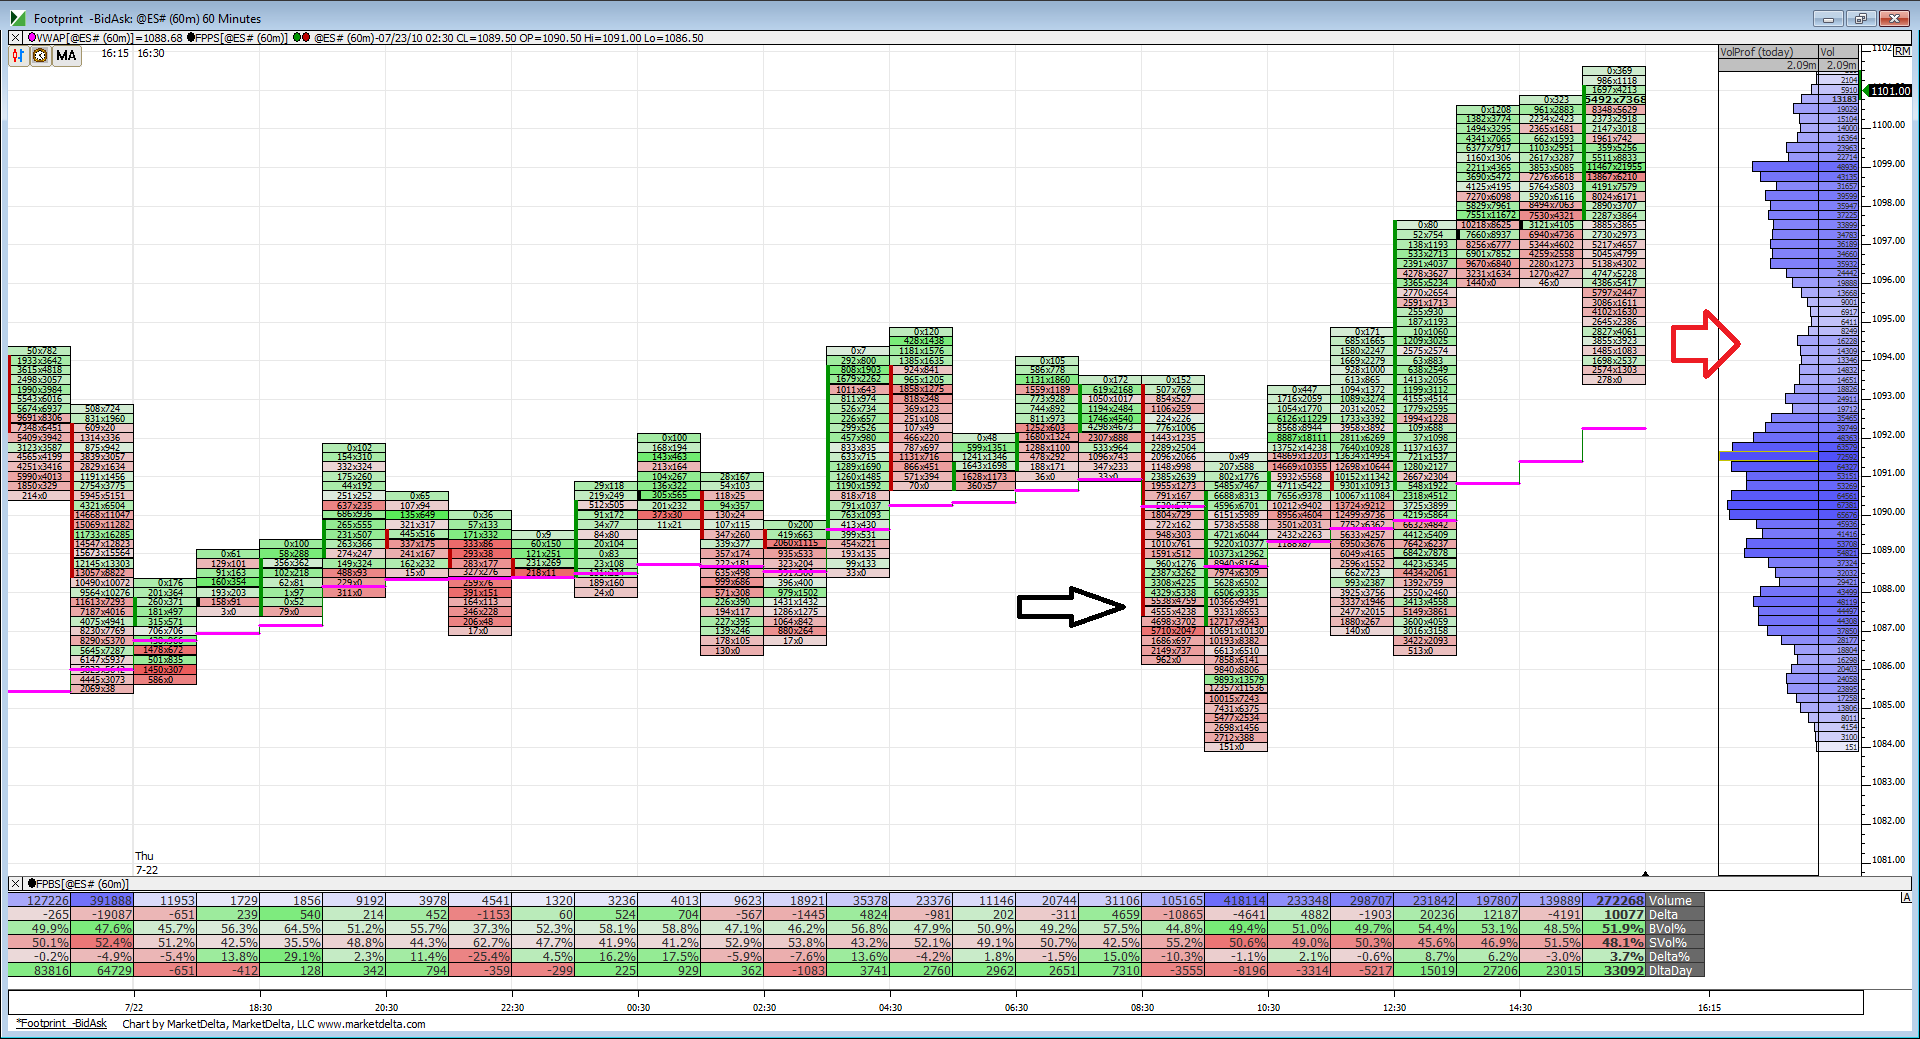
Here is a 60-min foot print chart of the entire session on Friday beginning with the globex open Thursday evening, you can see the Thu 7-22 on the starting grey divider.
The first thing which jumped out at me was only one close on a 60 min basis under VWAP for the whole session. (Marked by black arrow).
Second is the area marked by red arrow. Notice how the last 60 minutes on Friday traded down and into this low volume valley before heading to its closing highs. I'm not really sure what that means exactly but from a MP perspective it seems the breakout from earlier in the day left the valley needing more time with prices in it. (Does that make sense Bruce?)
That volume build between 1099-1096 shows acceptance of price but volume quickly fell off above 1100.
Clearly VWAP supported the bullish case today even though it was a fight in the morning session of RTH.
Click image for original size
Emini Day Trading /
Daily Notes /
Forecast /
Economic Events /
Search /
Terms and Conditions /
Disclaimer /
Books /
Online Books /
Site Map /
Contact /
Privacy Policy /
Links /
About /
Day Trading Forum /
Investment Calculators /
Pivot Point Calculator /
Market Profile Generator /
Fibonacci Calculator /
Mailing List /
Advertise Here /
Articles /
Financial Terms /
Brokers /
Software /
Holidays /
Stock Split Calendar /
Mortgage Calculator /
Donate
Copyright © 2004-2023, MyPivots. All rights reserved.
Copyright © 2004-2023, MyPivots. All rights reserved.