ES Short Term Trading 7-30-10
So the POC is right at 1100 even:
http://www.mypivots.com/board/topic/5894/2/value-areas-and-point-of-control-2010-q3#64840
Economic Events for Friday:
08:30 AM GDP
08:30 AM Employment Cost Index
09:45 AM Chicago PMI
09:55 AM Consumer Sentiment
03:00 PM Farm Prices
http://www.mypivots.com/trading/economicevents
http://www.mypivots.com/board/topic/5894/2/value-areas-and-point-of-control-2010-q3#64840
Economic Events for Friday:
08:30 AM GDP
08:30 AM Employment Cost Index
09:45 AM Chicago PMI
09:55 AM Consumer Sentiment
03:00 PM Farm Prices
http://www.mypivots.com/trading/economicevents
everyone who cares...bring up your 15 minute chart and look at the beauty Low range bar....near 97 - 98 area!!...hence another reason I would have exited before the ledge run...
NQ is the only contract which wasn't able to close above its O/N high today. It's still lagging and if the ES wants to move higher NQ must join the party. My experience is these two rarely show divergence for long.
Woops...my bad. Was just studying my charts and realized I had NQ O/N high marked incorrectly.
Disregard what I just posted above.
Disregard what I just posted above.
Can you explain further your low range bar idea?
I'm assuming you use them as resistance points?
Cheers.
I'm assuming you use them as resistance points?
Cheers.
Originally posted by BruceM
everyone who cares...bring up your 15 minute chart and look at the beauty Low range bar....near 97 - 98 area!!...hence another reason I would have exited before the ledge run...
98.75 is developing VA high, POC volume from YD and 2nd deviation Vwap band....just an FYI.....not trading anymore...nothing worse then ending with a bad trade on a friday...so can't risk that today.....it will be interesting once this ledge gets busted though...this would have been a lot of suffering trying to get that ledge....always good to take some off in front of key stop points...just to be safe..let the runners be the bulldogs for final targets
I use to use them for breakout trades but now use them for targets and to confirm areas...in this case the long players would really like to get above that and not drop below it...so it becomes support after the breakout.....just like it is being resistance now
There is a thread somewhere but not sure how deep I explained things there
There is a thread somewhere but not sure how deep I explained things there
Originally posted by Lorn
Can you explain further your low range bar idea?
I'm assuming you use them as resistance points?
Cheers.
Originally posted by BruceM
everyone who cares...bring up your 15 minute chart and look at the beauty Low range bar....near 97 - 98 area!!...hence another reason I would have exited before the ledge run...
they are far from perfect Lorn but really help spotting the congestion areas as 15 minutes is a long time to be stuck in 1.25 point range like that one we have now...we can assume that low volatilty ( range) preceeds big volatility..so you see expanded range off those often
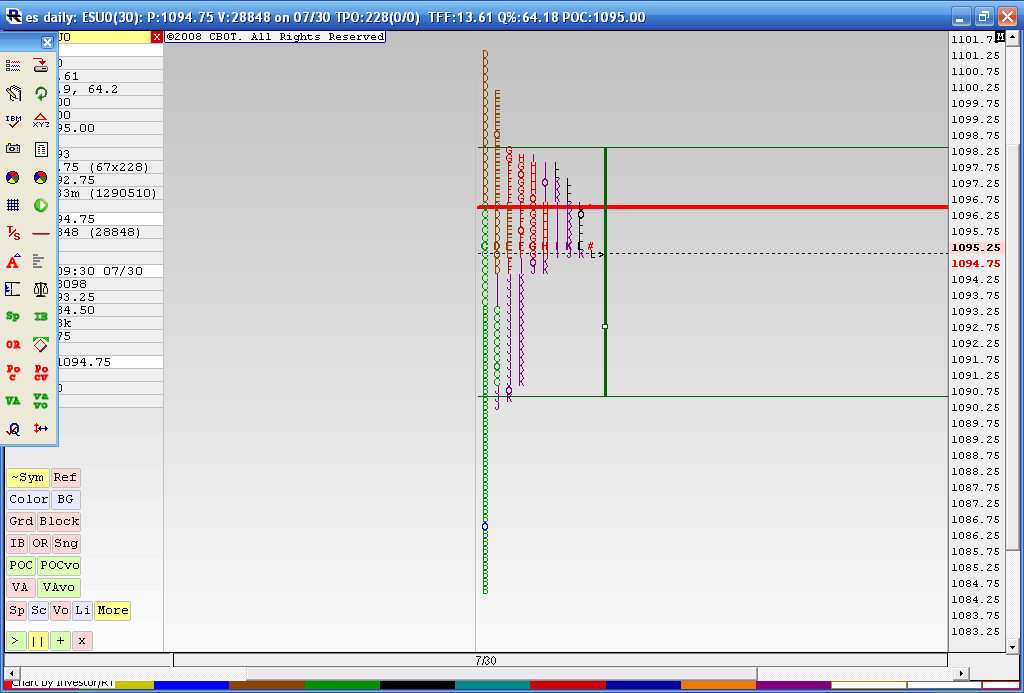
here is how we look at 3 pm for those who don't have MP...the "P" pattern
Click image for original size
Thanks Bruce!
Makes great sense.
Makes great sense.
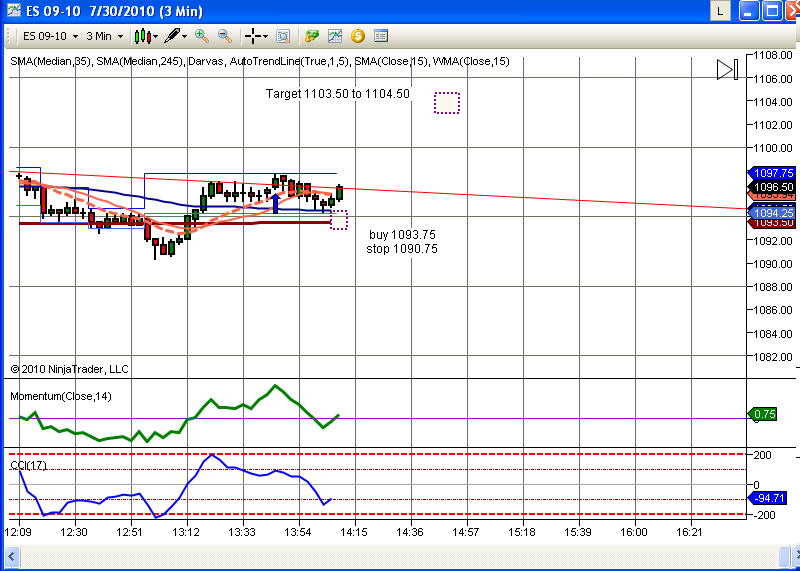
1104 looks possible before close today.
(currently 1094 area)
(currently 1094 area)
Click image for original size
You're sharp,Wendy! Actually , i dont normally use fib retracements, just my Kools tools fib extentions. Sometimes, tho at what i feel may be an important high or low, I sometimes look around for any other kind of corraborating evidence to support my theory (like is there support or resistance here?,are any cycles topping or bottoming here,is this a previous high vol zone?,...etc). Probably just a confidence booster. I have never found fib retracements to be tradable. Doesnt mean they arnt, just not for me. In this case i believed the low was important in that i was looking for the daily low to be made here, and possibly for the next few sessions. I was caught a little off guard as if memory serves, i had just logged on 5-10 min before it occurred and really had no time for much study!. That in itself speaks to the power (and confidence i have) in my fib extentions. Hope this helps explain my view and actions a little better.
Emini Day Trading /
Daily Notes /
Forecast /
Economic Events /
Search /
Terms and Conditions /
Disclaimer /
Books /
Online Books /
Site Map /
Contact /
Privacy Policy /
Links /
About /
Day Trading Forum /
Investment Calculators /
Pivot Point Calculator /
Market Profile Generator /
Fibonacci Calculator /
Mailing List /
Advertise Here /
Articles /
Financial Terms /
Brokers /
Software /
Holidays /
Stock Split Calendar /
Mortgage Calculator /
Donate
Copyright © 2004-2023, MyPivots. All rights reserved.
Copyright © 2004-2023, MyPivots. All rights reserved.