ES Short Term Trading 8-5-2010
Also why I point out the divergence of 50% retrace levels between cash/futures. I don't know what it means, but interesting to note here, and seems to be a significant disparity between the two.
here is a thread I did back in 2006....divergences between Dow and ES...it may be of value....it has evolved a bit but the general ideas are the same...
Anyone notice the new high in ES yesterday Afternoon while the YM couldn't get over it's high?
http://www.mypivots.com/board/topic/1287/1/a-pitbull-setup
Anyone notice the new high in ES yesterday Afternoon while the YM couldn't get over it's high?
http://www.mypivots.com/board/topic/1287/1/a-pitbull-setup
Thanks Bruce. As I said earlier, I tend to go with NQ but its the same principle.
Cheers!
And this volume is beyond slow....something is gonna break.
Cheers!
And this volume is beyond slow....something is gonna break.
Originally posted by BruceM
here is a thread I did back in 2006....divergences between Dow and ES...it may be of value....it has evolved a bit but the general ideas are the same...
Anyone notice the new high in ES yesterday Afternoon while the YM couldn't get over it's high?
http://www.mypivots.com/board/topic/1287/1/a-pitbull-setup
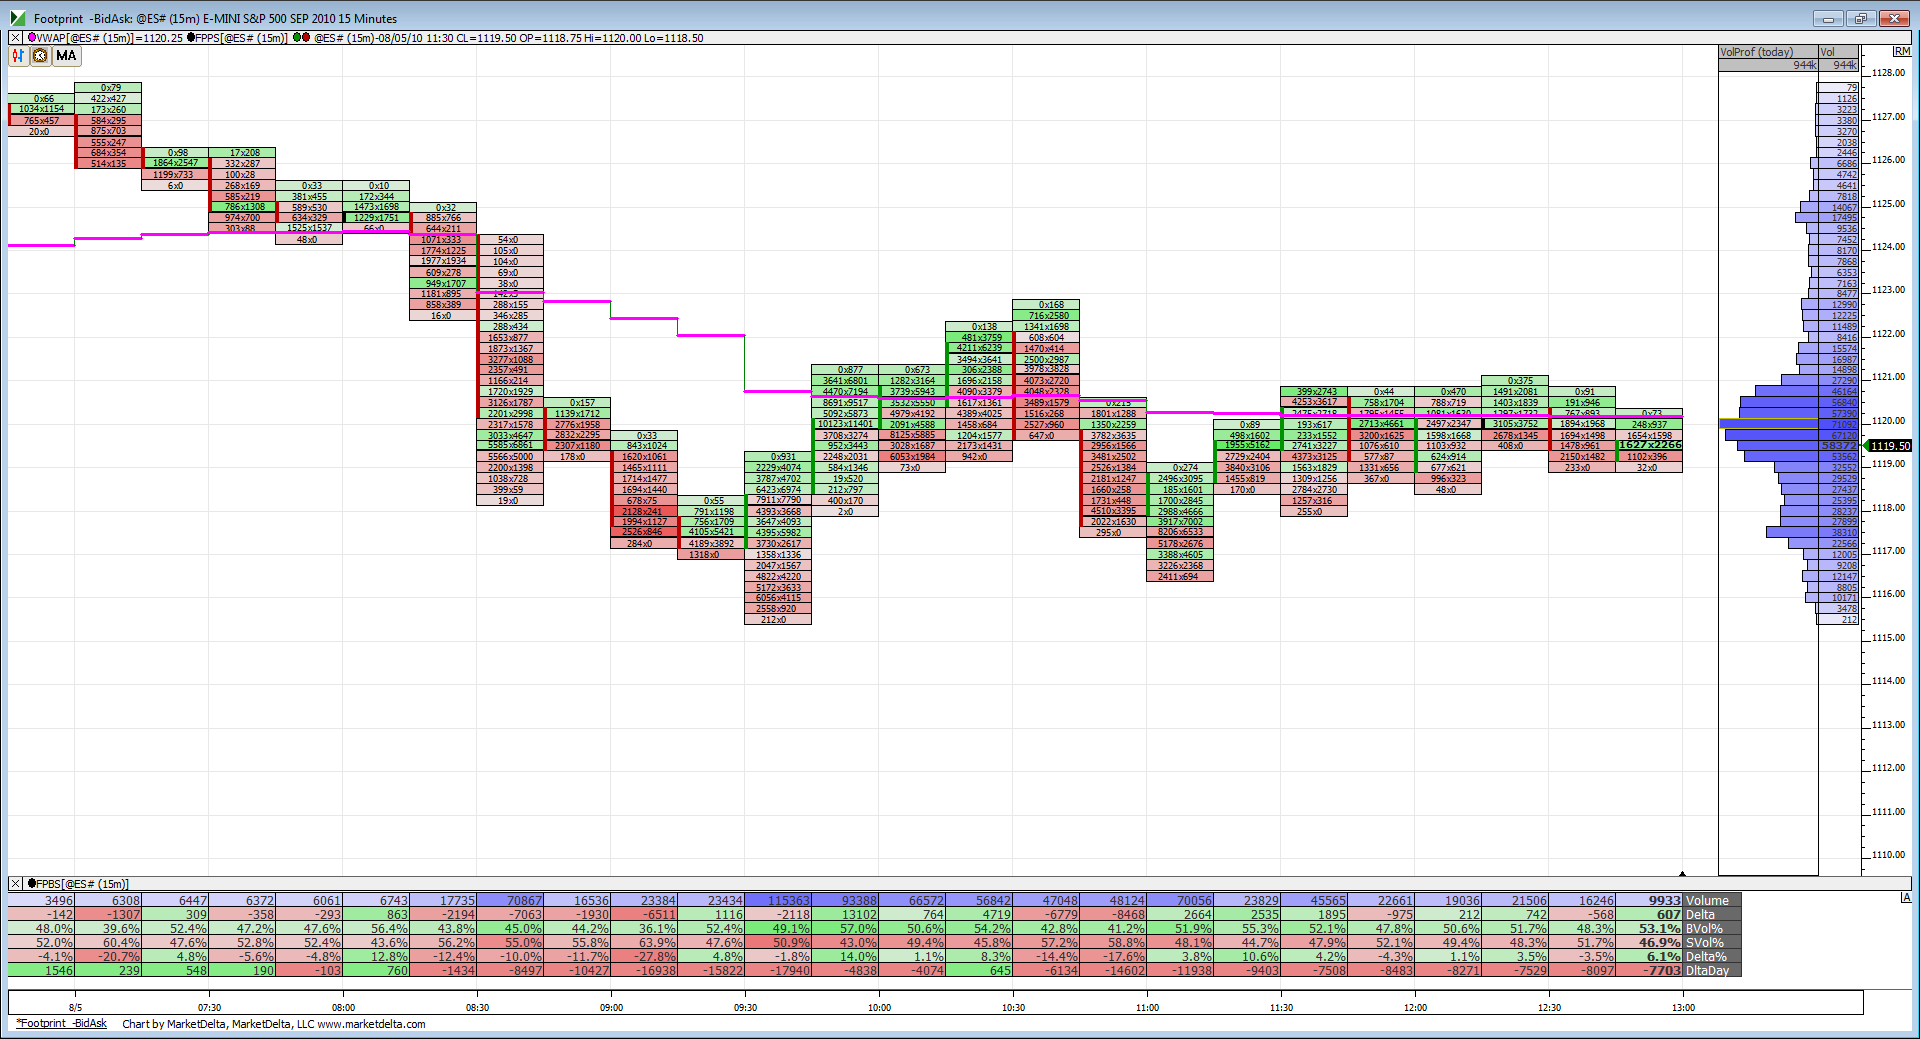
Look at this straight sideways action. A precursor to a big move once the break occurs. Which way? The evidence in my opinion is not clearly pointing in one direction. We have VWAP seeming to provide resistance but volume is putrid except for that one time on the reversal earlier.
Click image for original size
What's the old saying?
"The first move is usually the false move."
"The first move is usually the false move."
Originally posted by Lorn
What's the old saying?
"The first move is usually the false move."
market unstucked ? like your posts very informative !
Bruce, I think this is fantastic. Especially the averaging in concept. This is a big reason the 1 lot trader gets killed.
Originally posted by BruceM
I average into trades and only trade the ES but to answer your question: I donot usually wait, I like to see a big volume flush with some good low TICK reading or divergence in Ticks..then I initiate.....You can also use a trade above the high of the low bar to initiate long but then we get into the question of which time frame to use for that particular entry...I never met anyone who can consistently call tops and bottoms and that is why I average in. I also have an "Uncle" point where I will pull the plug if I am wrong....
Tuesday and Wednesday narrow range ... and today narrow so far. It may break one direction or the other before the close with folks shoring up positions coming into the (un)employment report tomorrow morn'.
And yeah, the market's showing the typical dry-up of Summer volume. But if the mkt comes into the close without (or without much of) a move today, option premiums are looking semi-decent. They may jack 'em up some coming into the close. But might be a nice time and place to buy a straddle or strangle position in the last 5-15 minutes of the mkt session.
Just an idea. If I do it, I'll be posting when I put it on. Anyway, just tossing out an idea.
The comparison between today and YD are truely fascinating when we consider the following:
1)YD we opened in the previous days range and took out the high of the previous days range first.
Today we opened in YD range and took out the low first
2)YD we found support off the Previous days POC and today we found resistance at YD POC
3) We Broke the IB low first YD into the POC just barely and
today we broke the IB high first just barely into the POC
so we are exact opposite so far today.....it will be really cool if they sell it at the end to make new lows today...just like they did at the highs YD
Not trading anymore today...just babbling
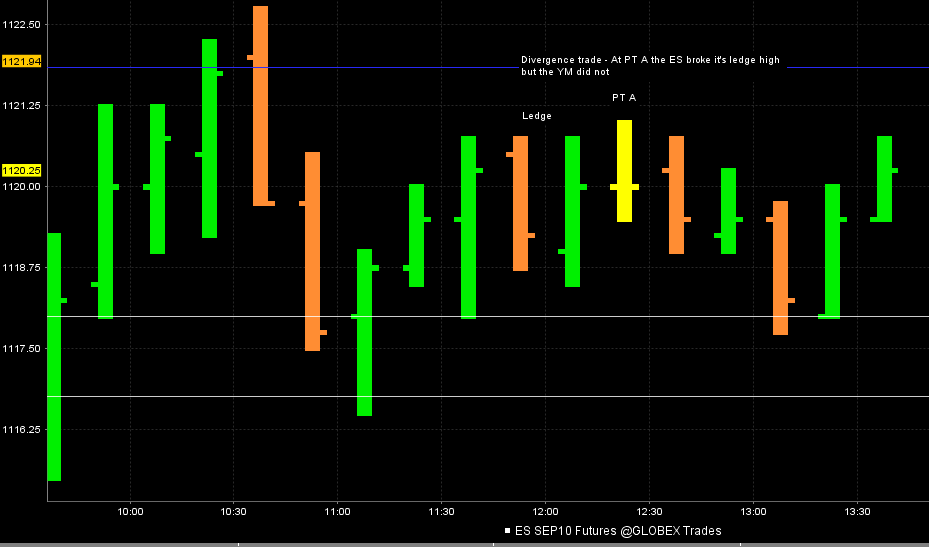
Here was a divergence trade from today...I didn't take this just for the record....these types of trades work better in consolidation periods when they are fishing for orders/stops
Click image for original size
No problem Lorn, msg me if need any help
Emini Day Trading /
Daily Notes /
Forecast /
Economic Events /
Search /
Terms and Conditions /
Disclaimer /
Books /
Online Books /
Site Map /
Contact /
Privacy Policy /
Links /
About /
Day Trading Forum /
Investment Calculators /
Pivot Point Calculator /
Market Profile Generator /
Fibonacci Calculator /
Mailing List /
Advertise Here /
Articles /
Financial Terms /
Brokers /
Software /
Holidays /
Stock Split Calendar /
Mortgage Calculator /
Donate
Copyright © 2004-2023, MyPivots. All rights reserved.
Copyright © 2004-2023, MyPivots. All rights reserved.