ES Short Term Trading 8-5-2010
I do watch Nq but not for the things you mentioned...to try and get a feel if volume and $tick divergences will have abetter chance of working
a good example today of why late day fades should be done with care and much lighter...I mean really, how the H-e- (double toothpicks) ll are we REALLY suppose to trade that from home....Ridiculous at best....
Hey Lorn, Does Dr. B prefer the 15 minute volume or the 30 minute....? Not sure he ever really said..for his benchmarks
Hey Lorn, Does Dr. B prefer the 15 minute volume or the 30 minute....? Not sure he ever really said..for his benchmarks
You are right he has never really said which he prefers. I've seen him use 15, 30 and 60 min time periods.
I think the important thing is to be consistent with what you are looking at so you will develop the insight into expanding/contracting relative volume.
I think the important thing is to be consistent with what you are looking at so you will develop the insight into expanding/contracting relative volume.
Originally posted by BruceM
Hey Lorn, Does Dr. B prefer the 15 minute volume or the 30 minute....? Not sure he ever really said..for his benchmarks
Here is a good write up on relative volume by him.
http://traderfeed.blogspot.com/2010/03/importance-of-relative-volume-is-it.html
http://traderfeed.blogspot.com/2010/03/importance-of-relative-volume-is-it.html
The Importance of Relative Volume: Is It a Slow Day or a Go Day?
I received an email from a trader who lost a good amount of money today trading the stock indexes. He was particularly frustrated because the money was lost during a day when there was little overall movement and opportunity. Indeed, the daily range in SPY today was only about .39% on volume that was one of the lowest for 2010.
The trader's problem was that he identified the limited opportunity set only after he had lost his money. Instead of first identifying the day's likely level of opportunity and trading accordingly, he placed his capital at risk--only to discover the lack of opportunity.
One of the most valuable tools for identifying opportunity is relative volume. Seeing how today's volume compares to recent volume at that same time of day provides a perspective on how much institutional participation is in the marketplace. Markets need that participation in order to move: volume is the source of market energy. Without the energy of market volume, stocks may move higher or lower, but those moves are likely to be muted in magnitude.
Going back to 2009 in SPY, we find that daily volume correlates with daily trading range by a whopping .85. That means that over 70% of all variance in market movement (range) is accounted for by shifts in market volume.
By tracking how early volume compares to average volume early in the day, we can begin to get a proactive read on likely levels of market movement. The key to successful trading is not just scouring for market setups. The key is first asking whether markets are moving enough to justify trading those setups.
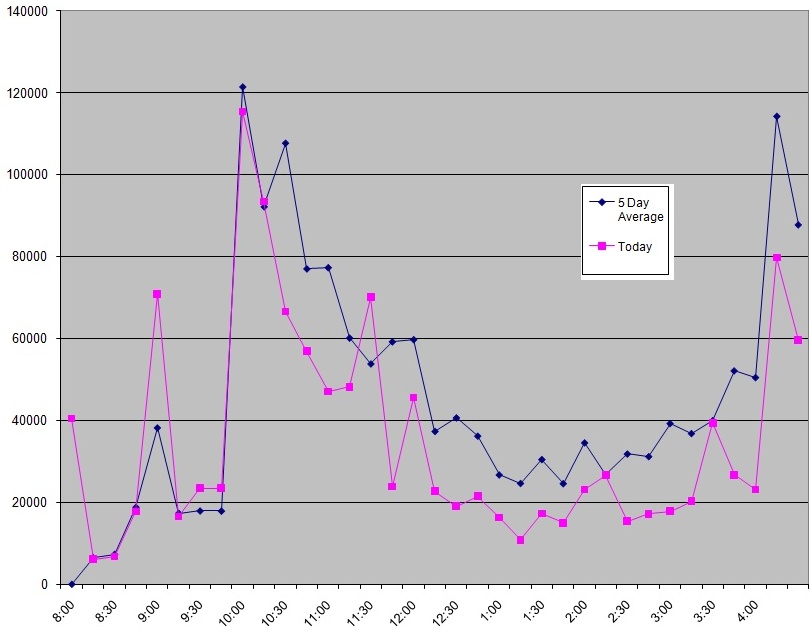
So there you have volume for the day starting at 8:00am.
The drop off starting after 10:15 was a huge early sign we were range bound. Obviously not a complete guarantee but something to alert us to the potential.
The drop off starting after 10:15 was a huge early sign we were range bound. Obviously not a complete guarantee but something to alert us to the potential.
Click image for original size
First post here
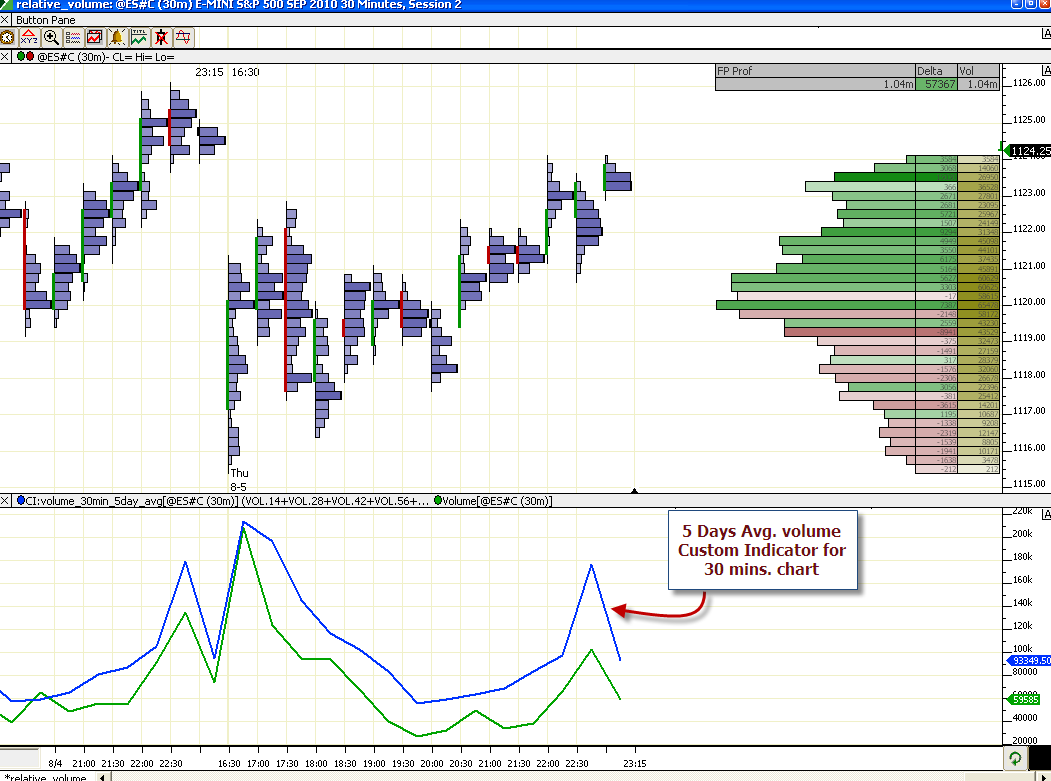
You can do an avg. volume study with a custom indicator, see my attached chart
You can do an avg. volume study with a custom indicator, see my attached chart
Click image for original size
Hey that's sweet.
Can you explain how to set up the custom indicator?
and welcome to the forum!
Can you explain how to set up the custom indicator?
and welcome to the forum!
Originally posted by dda
First post here
You can do an avg. volume study with a custom indicator, see my attached chart
Click image for original size
agree lorn..that would make things easy...
Originally posted by goodegg
hi y'all,
am new to the forum, but have been reading and learning.
Do you pay attention to ledges in TF, NQ, YM etc. I think there is one
at 657.9 on the TF
Hi goodegg - welcome to the forum. It helps if you post a chart of what you're seeing when you ask a question like that as it helps other traders visualize what you think a ledge might be.
You need the pro version of IRT or MD to use a custom indicator,
then it's a simple formula for the CI:
(VOL.14+VOL.28+VOL.42+VOL.56+VOL.70)/5 and add it to the chart.
The VOL.14 is taking the volume value of 14 bars ago. On a 30 min. chart it's exactly one day ago (RTH). For a 15 min. chart you need to double the values.
Holiday sessions can mess up the indicator, but they're rare..
Here's how a Custom Indicator looks like:
http://www.linnsoft.com/tour/customIndicator.htm
No problem Lorn, msg me if need any help
Emini Day Trading /
Daily Notes /
Forecast /
Economic Events /
Search /
Terms and Conditions /
Disclaimer /
Books /
Online Books /
Site Map /
Contact /
Privacy Policy /
Links /
About /
Day Trading Forum /
Investment Calculators /
Pivot Point Calculator /
Market Profile Generator /
Fibonacci Calculator /
Mailing List /
Advertise Here /
Articles /
Financial Terms /
Brokers /
Software /
Holidays /
Stock Split Calendar /
Mortgage Calculator /
Donate
Copyright © 2004-2023, MyPivots. All rights reserved.
Copyright © 2004-2023, MyPivots. All rights reserved.