ES short term trading 8-11-10
Volume numbers I'm using on Wedsneday from the RTH session
1111.25
1114.50
1118.75
We'll confirm in the mornming once O/N session completes.
1111.25
1114.50
1118.75
We'll confirm in the mornming once O/N session completes.
Range based S/R
R1 = 1130.125
S1 = 1103.875
R2 = 1134.50
S2 = 1099.50
Steenbarger Pivot = 1118.875
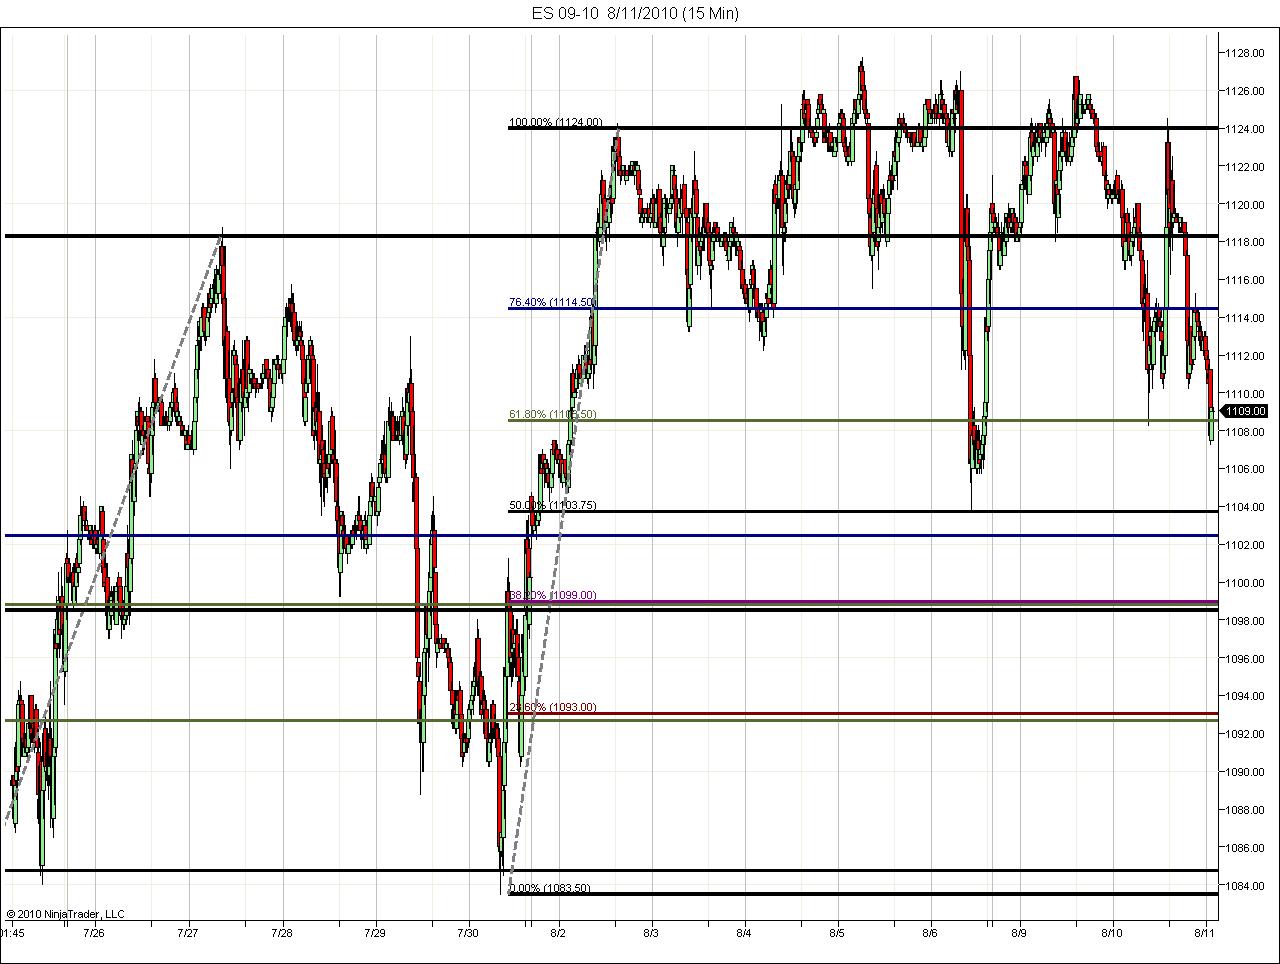
I'll be watching the 1119.00-1119.75 zone. Multiple 30 min long term fib projections here.
Also 1110.75 is important. Another fib that prices couldn't close beneath on a 30 min time frame Tuesday. Here we are at 11:45pm est in O/N and prices have challenged this level again and still unable to close beneath it on a 30 min time frame.
R1 = 1130.125
S1 = 1103.875
R2 = 1134.50
S2 = 1099.50
Steenbarger Pivot = 1118.875
I'll be watching the 1119.00-1119.75 zone. Multiple 30 min long term fib projections here.
Also 1110.75 is important. Another fib that prices couldn't close beneath on a 30 min time frame Tuesday. Here we are at 11:45pm est in O/N and prices have challenged this level again and still unable to close beneath it on a 30 min time frame.
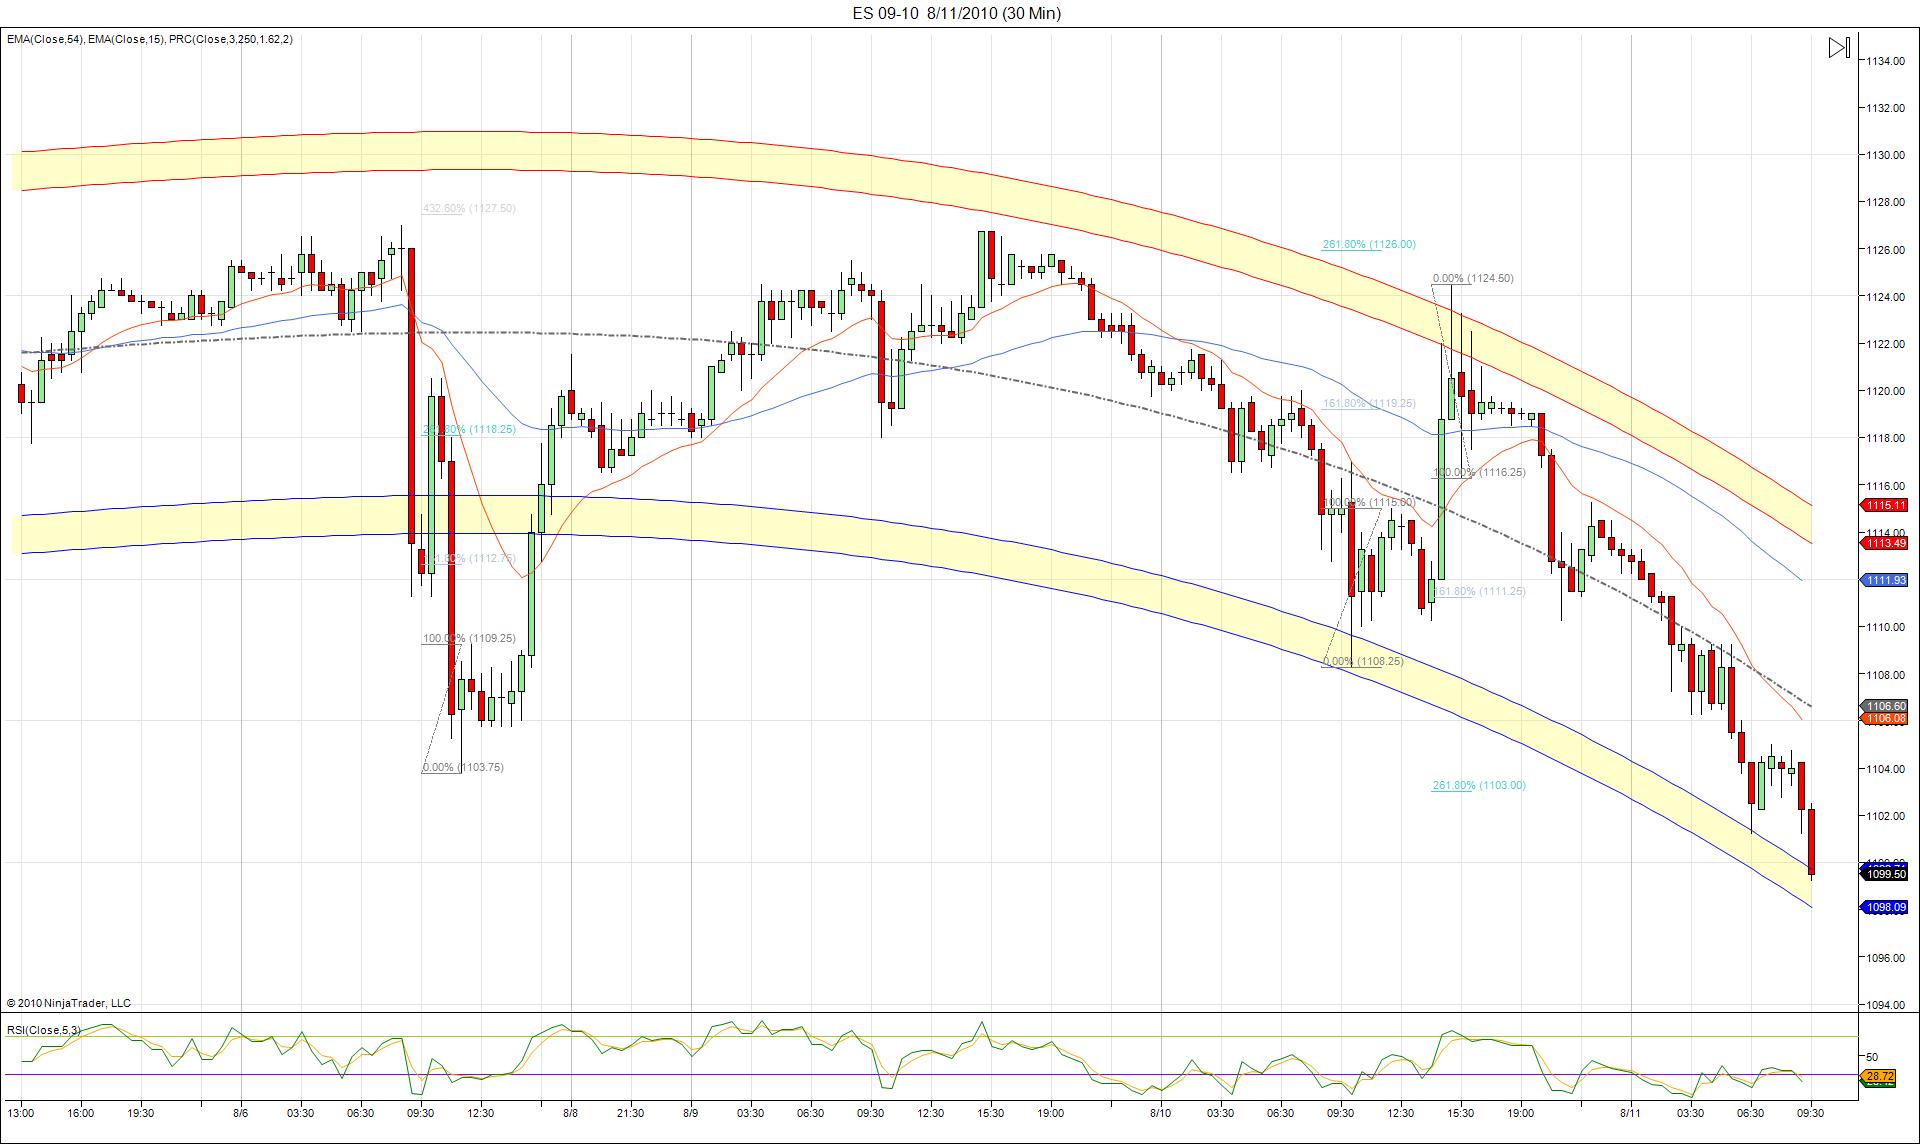
Nice potential reversal pattern as long as this downwave ends between the previous 2 lows to the left(1104 and 1108.25).
Click image for original size
Right now (AH Tues into Wed, AUG 11, 2010) maybe price is being attracted to magnet of closing the gap created by the pop on AUg 1.
The previous day's closes were
7/30/2010 4:15 C was 1100.25
7/30/2010 4:00 C was 1097.75
either that or a DB forming that can move up into a test of Tuesday's RTH range like 1108.25 test of Low. (I'm guessing more like a short-term intraday DB, will let first 5m bar play out, but I expect 1108.25 to print early.
if first 5 down and breaks lower, would be watching 5 day average of L v Open
first test is usually worth a counter move.
5Day ave of LvO = 5.45
that means Open minus 5.45 would be price level (if hit) that could produce bounce.
5 day average of H versus Open is 6.55
also, Low of last week is 1103.75 and first test of that level (RTH) can produce some sort of bounce
Lorn, has kool's PRC issued anything of interest?
1100.25 is also 50% of previous month's RTH range, you have to give the monthly data wiggle room, but on a first test, this is also a price level that can produce a perfunctory bounce
below last weeks low ( the 1103 area) we have key volume at 95 - 97.50
below that is 88.50 !!
above last weeks low ,should they rally, they will be using 1107.75 and 1111.25
as usually we also need to think about the key RAT 1100 !!!
below that is 88.50 !!
above last weeks low ,should they rally, they will be using 1107.75 and 1111.25
as usually we also need to think about the key RAT 1100 !!!
I've got 1095-1096 as the next multiple long term fib confluence zone.
Prices blew through all support from yesterday in O/N. Is this a big change of direction or retests of important levels lower before heading higher?
Prices blew through all support from yesterday in O/N. Is this a big change of direction or retests of important levels lower before heading higher?
Footprint chart into the open.
Click image for original size
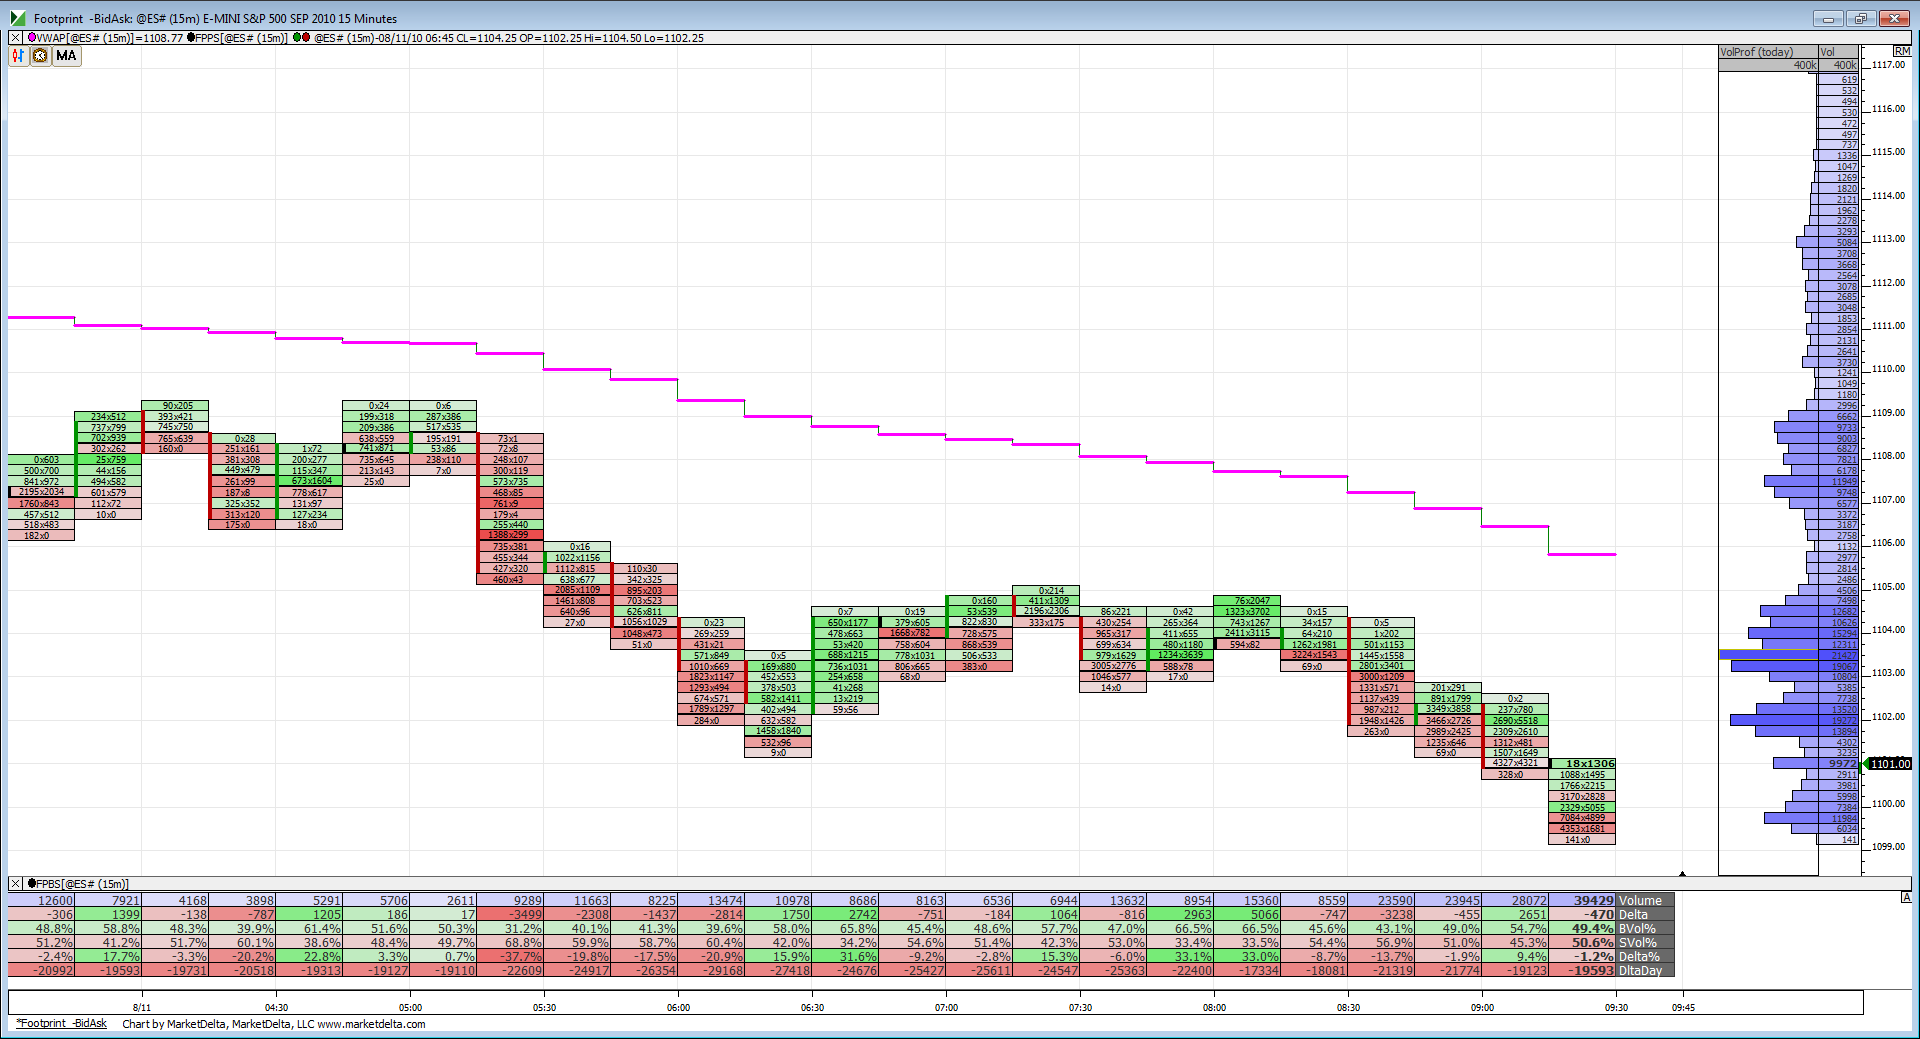
lV area from O/N is 1106....my prefered plan is to buy on a first push down under 98 and try to target 1100, 1103.75 and 1106...that's my basic idea....
prefered sell area is 1103.75
prefered sell area is 1103.75
can easily see buying right at the open.
I watch NQ, too and NQ did not undercut it's AH Low in the minutes just prior to RTH.
I watch NQ, too and NQ did not undercut it's AH Low in the minutes just prior to RTH.
LOL Bruce I kind of felt the way you did about that post, however I am lacking your diplomacy when dealing with such feelings. I also have suffered in the past with trend days and like you are becoming more able to deal with them. Like you with the ES down 25+ and average range recently at 23-25 Shorting or looking for more downside for the day seems like a very low probability. Standing aside for both of us was certainly a wise move.
Emini Day Trading /
Daily Notes /
Forecast /
Economic Events /
Search /
Terms and Conditions /
Disclaimer /
Books /
Online Books /
Site Map /
Contact /
Privacy Policy /
Links /
About /
Day Trading Forum /
Investment Calculators /
Pivot Point Calculator /
Market Profile Generator /
Fibonacci Calculator /
Mailing List /
Advertise Here /
Articles /
Financial Terms /
Brokers /
Software /
Holidays /
Stock Split Calendar /
Mortgage Calculator /
Donate
Copyright © 2004-2023, MyPivots. All rights reserved.
Copyright © 2004-2023, MyPivots. All rights reserved.