ES short term trading 8-11-10
Volume numbers I'm using on Wedsneday from the RTH session
1111.25
1114.50
1118.75
We'll confirm in the mornming once O/N session completes.
1111.25
1114.50
1118.75
We'll confirm in the mornming once O/N session completes.
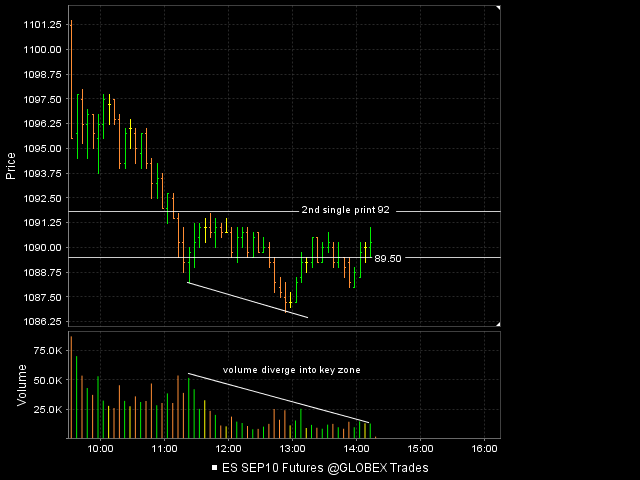
here is a chart of this concept...we had triples above and the 89.50 volume as targets....entry is sometimes scary...but this was the second test of that zone..below 89 started that key zone so you would be looking for longs on the low volume test
here is how the $ticks diverged
Originally posted by BruceM
all 6 off at air fill...filled at 91....flat......cool zone....lets see if they give us the low volume retest with some divergence
Click image for original size
here is how the $ticks diverged
Click image for original size
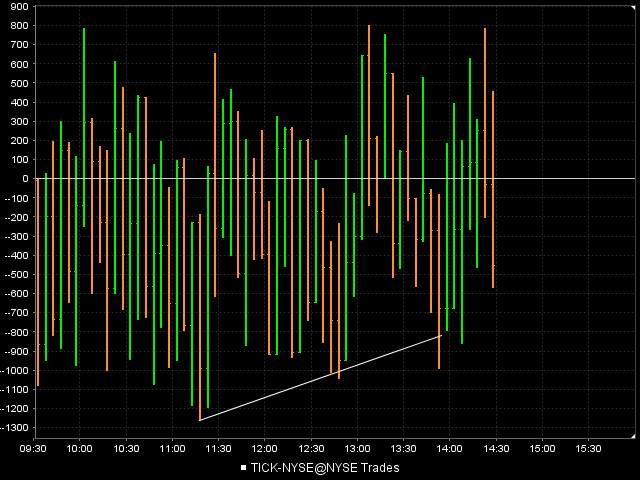
I will not fade new lows now....they tested above our 89 number and failed to find buyers......so this would be high risk to fade at the lows now..better to go with it
Bruce,
the trips were at 91.00. I see that
but the volume at 89.50, you are just talking about large volume, the bar you started your descending volume trendline from, right?
the trips were at 91.00. I see that
but the volume at 89.50, you are just talking about large volume, the bar you started your descending volume trendline from, right?
yes Paul...I'll look at the one minute thrusts and the peak volume and if I have my Investor R/t fired up I will look at the tic chart and see where the precise volume point came from and the exact price...these become magnets...like the 96.50 this morning...somebody with alot of contracts did something at those prices and they get tested often....they also tend to form the peak volume price of the day quite often...like the 18.75 yesterday.....what messes up a volume profile is that huge volume comes in at 4pm close so that affects the peak volume price sometimes
let me know if that is clear as it is a kick-ass concept!!
let me know if that is clear as it is a kick-ass concept!!
Originally posted by PAUL9
Bruce,
the trips were at 91.00. I see that
but the volume at 89.50, you are just talking about large volume, the bar you started your descending volume trendline from, right?
this attraction back to those volume thrusts form the peak volume points many days....
so on my radar for tomorrow and O/N is 96.50 and 89.50.....but those prices can be seen very early in the day usually
it's the constant testing that builds up the volume over time to make the areas even more powerful
so on my radar for tomorrow and O/N is 96.50 and 89.50.....but those prices can be seen very early in the day usually
it's the constant testing that builds up the volume over time to make the areas even more powerful
I think there is low interest on the thread right now, like the summer volume so I will fire up my IRT later and email you some more specific info to your email later tonight...the spikes come from the one minute first...then I dial it down,,,but more later
8/2 Gap: 1100.25 to 1110.25 completely filled today.
Looking at the current O/N session, maybe the 7/22 gap of 1064 to 1078.25 will get filled tomorrow
Looking at the current O/N session, maybe the 7/22 gap of 1064 to 1078.25 will get filled tomorrow
I have a question, don't hesitate to say if I'm out of line. Is everyone in this thread always fading and never trend following?
If always fading, I can understand the observations. If not, why, when price broke below 1106 area (8/6 support) wasn't it obvious that the next support level to be tested was 1092 area based on 7/30 equilibrium?
I was out all day, but my partner (and I via phone) were all over it.
These are the 20 pointers I was referencing a few weeks ago.
Good luck to all
Mike,Do you look at RTH charts or Globex Charts? What time frame charts do you look at to establish major support/resistance?
Originally posted by Big Mike
I have a question, don't hesitate to say if I'm out of line. Is everyone in this thread always fading and never trend following?
If always fading, I can understand the observations. If not, why, when price broke below 1106 area (8/6 support) wasn't it obvious that the next support level to be tested was 1092 area based on 7/30 equilibrium?
I was out all day, but my partner (and I via phone) were all over it.
These are the 20 pointers I was referencing a few weeks ago.
Good luck to all
Mike, In the O/N session ES is currently around 1077. If it opens in the mid 70s tomm morning, do you agree that the next major support level is around 1060?
Originally posted by Big Mike
I have a question, don't hesitate to say if I'm out of line. Is everyone in this thread always fading and never trend following?
If always fading, I can understand the observations. If not, why, when price broke below 1106 area (8/6 support) wasn't it obvious that the next support level to be tested was 1092 area based on 7/30 equilibrium?
I was out all day, but my partner (and I via phone) were all over it.
These are the 20 pointers I was referencing a few weeks ago.
Good luck to all
LOL Bruce I kind of felt the way you did about that post, however I am lacking your diplomacy when dealing with such feelings. I also have suffered in the past with trend days and like you are becoming more able to deal with them. Like you with the ES down 25+ and average range recently at 23-25 Shorting or looking for more downside for the day seems like a very low probability. Standing aside for both of us was certainly a wise move.
Emini Day Trading /
Daily Notes /
Forecast /
Economic Events /
Search /
Terms and Conditions /
Disclaimer /
Books /
Online Books /
Site Map /
Contact /
Privacy Policy /
Links /
About /
Day Trading Forum /
Investment Calculators /
Pivot Point Calculator /
Market Profile Generator /
Fibonacci Calculator /
Mailing List /
Advertise Here /
Articles /
Financial Terms /
Brokers /
Software /
Holidays /
Stock Split Calendar /
Mortgage Calculator /
Donate
Copyright © 2004-2023, MyPivots. All rights reserved.
Copyright © 2004-2023, MyPivots. All rights reserved.