ES Short Term Trading 8-12-2010
Range Based S/R
R1 = 1128.50
S1 = 1075.50
R2 = 1137.25
S2 = 1066.75
Steenbarger Pivot = 1093.50
ON has already traded to R1 and bounced off it. 1075 is also a fib projection down from longer term 30 min chart.
R1 = 1128.50
S1 = 1075.50
R2 = 1137.25
S2 = 1066.75
Steenbarger Pivot = 1093.50
ON has already traded to R1 and bounced off it. 1075 is also a fib projection down from longer term 30 min chart.
Thanks for the chart and explanation, Bruce.
wondered where you were.
Hey Lorn,
mea culpa mea culpa
RE: 84.00 handle
Yesterday's RTH Low was 84.50, another number for the cluster.
if price moves below previous day's Low (today, price OPENED below previous day's Low)... anyway, if price opens below previous day's Low then previous day's Low is a resistance until proven otherwise.
right now looks like a DT,
I will be watching to see if the belly in between the two tops at 84.50 is testied from underneath. (1080) which is looks like it is doing right now.
a break below 76.50 would turn all still holding longs bought after 9:35am into bag-holders (they would be absolutely underwater in their positions) and might make a dash for the exits.
Yea I've been thinking about that 1076.50 number since 1084.50 is showing resistance.
Originally posted by PAUL9
Thanks for the chart and explanation, Bruce.
wondered where you were.
Hey Lorn,
mea culpa mea culpa
RE: 84.00 handle
Yesterday's RTH Low was 84.50, another number for the cluster.
if price moves below previous day's Low (today, price OPENED below previous day's Low)... anyway, if price opens below previous day's Low then previous day's Low is a resistance until proven otherwise.
right now looks like a DT,
I will be watching to see if the belly in between the two tops at 84.50 is testied from underneath. (1080) which is looks like it is doing right now.
a break below 76.50 would turn all still holding longs bought after 9:35am into bag-holders (they would be absolutely underwater in their positions) and might make a dash for the exits.
Bruce,
I looked at my own 1 minute chart and see volume spikes for 76 and 79.50.
Just to see if I am getting this,
today, price moved up and came back to it short-term (almost immediately), and now longer-term in the afternoon here.
but what sort of a time parameter would you put on expectations for a revisit, like yesterday's 96.50? I know you observed late yesterday that you were no longer willing to fade lows, but how do you decide?
today, for the 79.50, price did come back and print there near 10:30am but how do you decide to short in anticipation of that? from the volume spike until the 10:30am revisit, price managed a High print of 81.75, would you just be adding to the position, or perhaps waiting for a $tick extreme?
No Lorn I don't, only that YD low is there ..always a key area....I don't post those as we all know where they are can see those.
Originally posted by Lorn
Bruce,
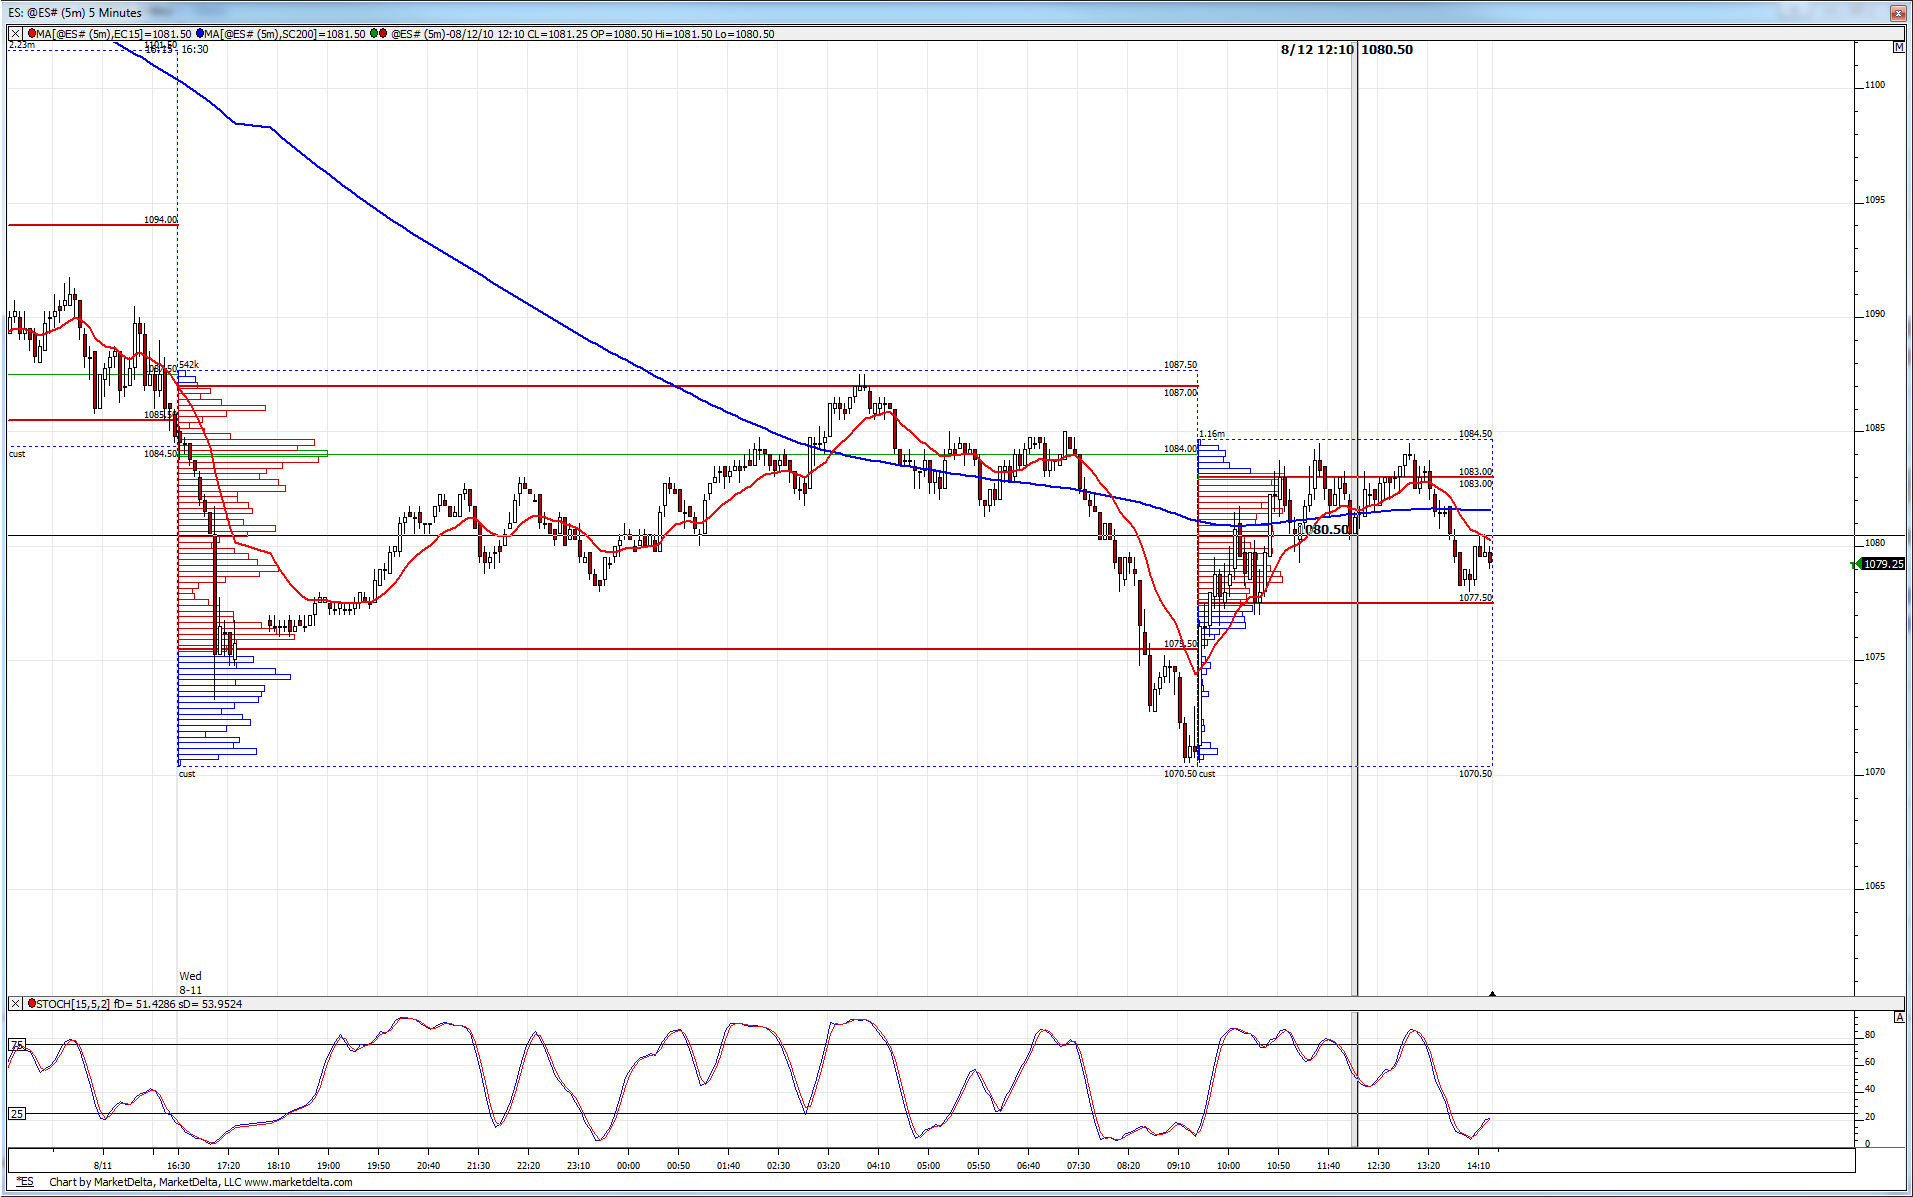
Here is a 5 min chart which I am tracking with volume profile on the O/N session then one on RTH session.
I notice 1084.00 is poc for O/N. RTH high is 1084.50. I realize this is gap fill for yesterday but do you see any significance with that 1084 POC number?
Click image for original size
For me they become points of awareness Paul and targets with a good signal....now on a TRUE trend day you will see many of these volume spikes and the market never comes back for them. so the context of the day is important...
The $tick extremes is obviously a good signal in context...I don't want to imply they are the be all and end all to trading but the concept of a large SPECIFIC block and price of volume hitting the market is good to be aware of...what happens is that the market often revisits these areas to see if there is interest again.....
I fired up my I/RT and the specific prices on the two big volume thrusts today are 77.50 and 81.50....so they will mess with those and soon....the day also ended with the peak volume price at 81.50
Originally posted by PAUL9
Bruce,
I looked at my own 1 minute chart and see volume spikes for 76 and 79.50.
Just to see if I am getting this,
today, price moved up and came back to it short-term (almost immediately), and now longer-term in the afternoon here.
but what sort of a time parameter would you put on expectations for a revisit, like yesterday's 96.50? I know you observed late yesterday that you were no longer willing to fade lows, but how do you decide?
today, for the 79.50, price did come back and print there near 10:30am but how do you decide to short in anticipation of that? from the volume spike until the 10:30am revisit, price managed a High print of 81.75, would you just be adding to the position, or perhaps waiting for a $tick extreme?
Emini Day Trading /
Daily Notes /
Forecast /
Economic Events /
Search /
Terms and Conditions /
Disclaimer /
Books /
Online Books /
Site Map /
Contact /
Privacy Policy /
Links /
About /
Day Trading Forum /
Investment Calculators /
Pivot Point Calculator /
Market Profile Generator /
Fibonacci Calculator /
Mailing List /
Advertise Here /
Articles /
Financial Terms /
Brokers /
Software /
Holidays /
Stock Split Calendar /
Mortgage Calculator /
Donate
Copyright © 2004-2023, MyPivots. All rights reserved.
Copyright © 2004-2023, MyPivots. All rights reserved.