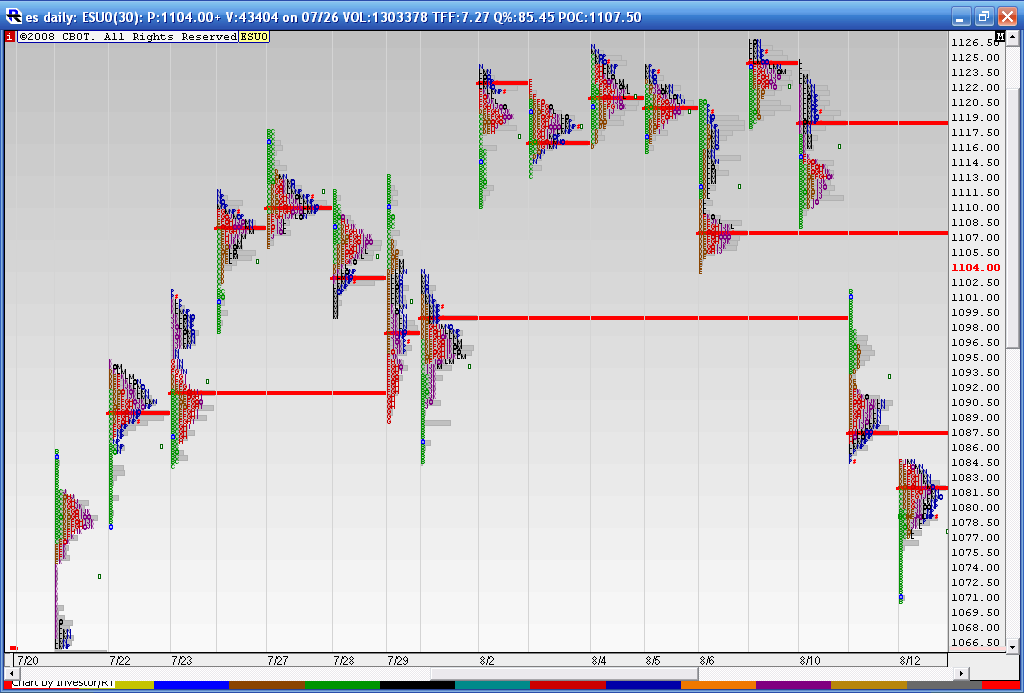
Volume Nodes
I'm hoping to get some discussion started on these. Most know them as Points of Control. O/N this chart they are based on volume not time so sometimes the 4 P.M EST close creates the high volume node and sometimes you can see more than one key node. Anyway , it's a start..
The red line is the peak volume for each day and my software automatically extends them over if the aren't traded through the next day
I had to shrink this down in order to fit these on the chart.
The red line is the peak volume for each day and my software automatically extends them over if the aren't traded through the next day
I had to shrink this down in order to fit these on the chart.
Click image for original size
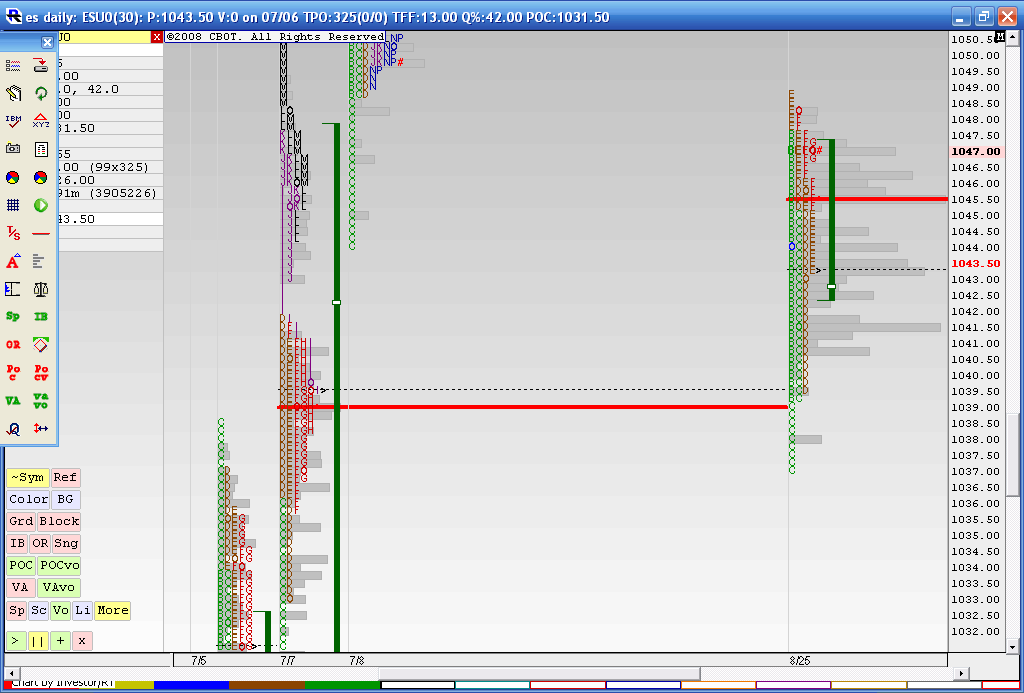
If we trade down to the 1040.50/1034.00 area do any of you node
traders see a node about the 1037.25 area..
thanks
traders see a node about the 1037.25 area..
thanks
Originally posted by redsixspeed
If we trade down to the 1040.50/1034.00 area do any of you node
traders see a node about the 1037.25 area..
thanks
=====================================================================
don't know if there was a node @ 1037.25...guess it don't matter now
Red, I will be posting the 39 - 40 node in the day trader thread over luch...soon I hope
Here it is Red....the red and black lines represent the POC of Volume and Time from the 7th of July..this chart also shows how the profile looks today went I captured this chart
Click image for original size
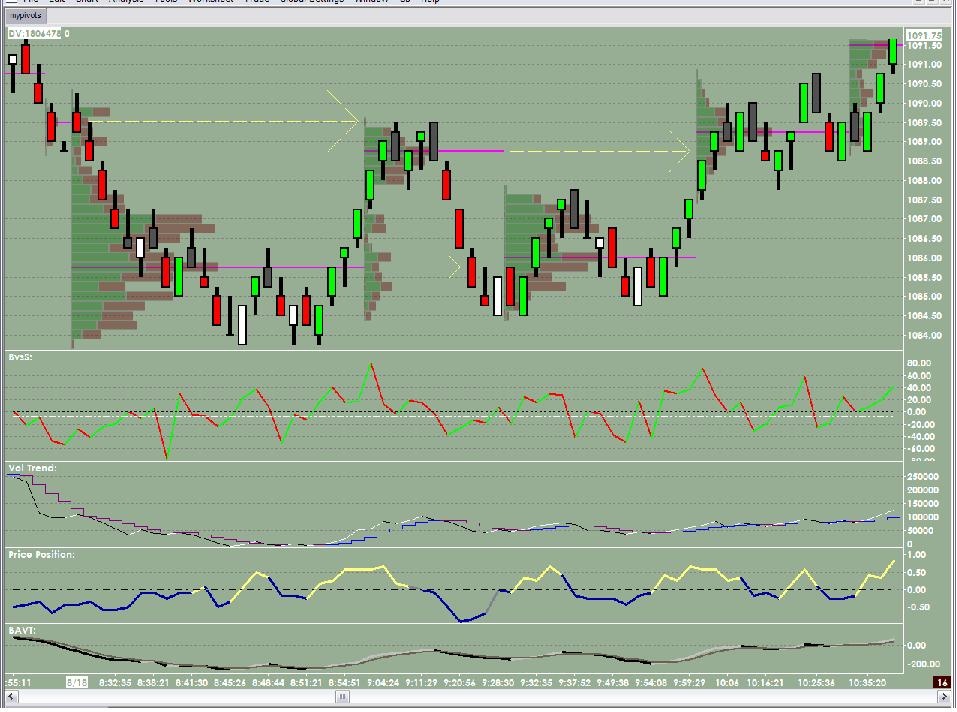
lets see if we can get some interest on this.......to start I'd like to know what specifically the lower panes are.....I can't read the chart.......then perhaps we can move to the application of those indicators/volume breakdowns
Originally posted by beyondMP
Here is a chart from the morning of 8/18 that illustrates the movement from node to node. You can also see, the info at bottom of the chart, which represents the breakdown of volume into several different parts, which can give a good "heads up" for entry and exits.
Click image for original size
Emini Day Trading /
Daily Notes /
Forecast /
Economic Events /
Search /
Terms and Conditions /
Disclaimer /
Books /
Online Books /
Site Map /
Contact /
Privacy Policy /
Links /
About /
Day Trading Forum /
Investment Calculators /
Pivot Point Calculator /
Market Profile Generator /
Fibonacci Calculator /
Mailing List /
Advertise Here /
Articles /
Financial Terms /
Brokers /
Software /
Holidays /
Stock Split Calendar /
Mortgage Calculator /
Donate
Copyright © 2004-2023, MyPivots. All rights reserved.
Copyright © 2004-2023, MyPivots. All rights reserved.