ES Short Term Trading 8-23-2010
here is how we look with Mondays trade so far added to last weeks ____ trading..
Lorn, I agree with you that if we can't hold this 69 - 70 then we could get a good selloff or at least down to 59 - 60 soon.
deleted due to fragile EGO!
Lorn, I agree with you that if we can't hold this 69 - 70 then we could get a good selloff or at least down to 59 - 60 soon.
deleted due to fragile EGO!
Here is todays and Fridays ______...that is where I got the 67 part of my 67 - 69 zone.....If ____ shows the _______ for a day then for any rally or selloff to take place they must resolve the points ( the _____)from previous days and previous weeks!.....It's logical and it works..
Not gonna ramble too much on this......too powerful for the common person to know...HA! Now we need to incorporate our knowledge of volume too....
Delete also....
Not gonna ramble too much on this......too powerful for the common person to know...HA! Now we need to incorporate our knowledge of volume too....
Delete also....
these are the way good consolidations form...like today and the battle between todays developing _____ and fridays _____..
Worthless...!!
Worthless...!!
It's sad to think that out of the 300 or 400 views this thread has had that NOBODY could of helped us out with Their POC as per volume from last week...?I'm deleteing my last two posts...as it can't all be so one - sided on these boards...we need more giving and less taking....so I can't continue to share things I'm working hard at...I'll stick to posting the ideas that still work but keep the newer ones to myself and emails...
Originally posted by BruceM
mine is based on Volume too....sometimes scaling can be an issue but perhaps mine is off due to IB's dealing with volume...anyway make sure you have it in .25 increments..sometimes to fit on a screen I scale it too .50 and it messes up my readings....not sure which one is right....perhaps someone else still reads these and can help out
Hey Bruce and Lorn, maybe, with the August slow/no volume (non)activity, no one's really doing much but puttering around "browsing." I know I've reeled in my stock trading quite a bit lately (yawn). Btw, the info you deleted was interesting. If anyone's trading or analyzing ES out there (I'm currently equity focused), vote some good posts up and toss out an idea for what ya may be seeing. Just a thought.
Good stuff Guys!
Good stuff Guys!
Originally posted by BruceM
It's sad to think that out of the 300 or 400 views this thread has had that NOBODY could of helped us out with Their POC as per volume from last week...?I'm deleteing my last two posts...as it can't all be so one - sided on these boards...we need more giving and less taking....so I can't continue to share things I'm working hard at...I'll stick to posting the ideas that still work but keep the newer ones to myself and emails...Originally posted by BruceM
mine is based on Volume too....sometimes scaling can be an issue but perhaps mine is off due to IB's dealing with volume...anyway make sure you have it in .25 increments..sometimes to fit on a screen I scale it too .50 and it messes up my readings....not sure which one is right....perhaps someone else still reads these and can help out
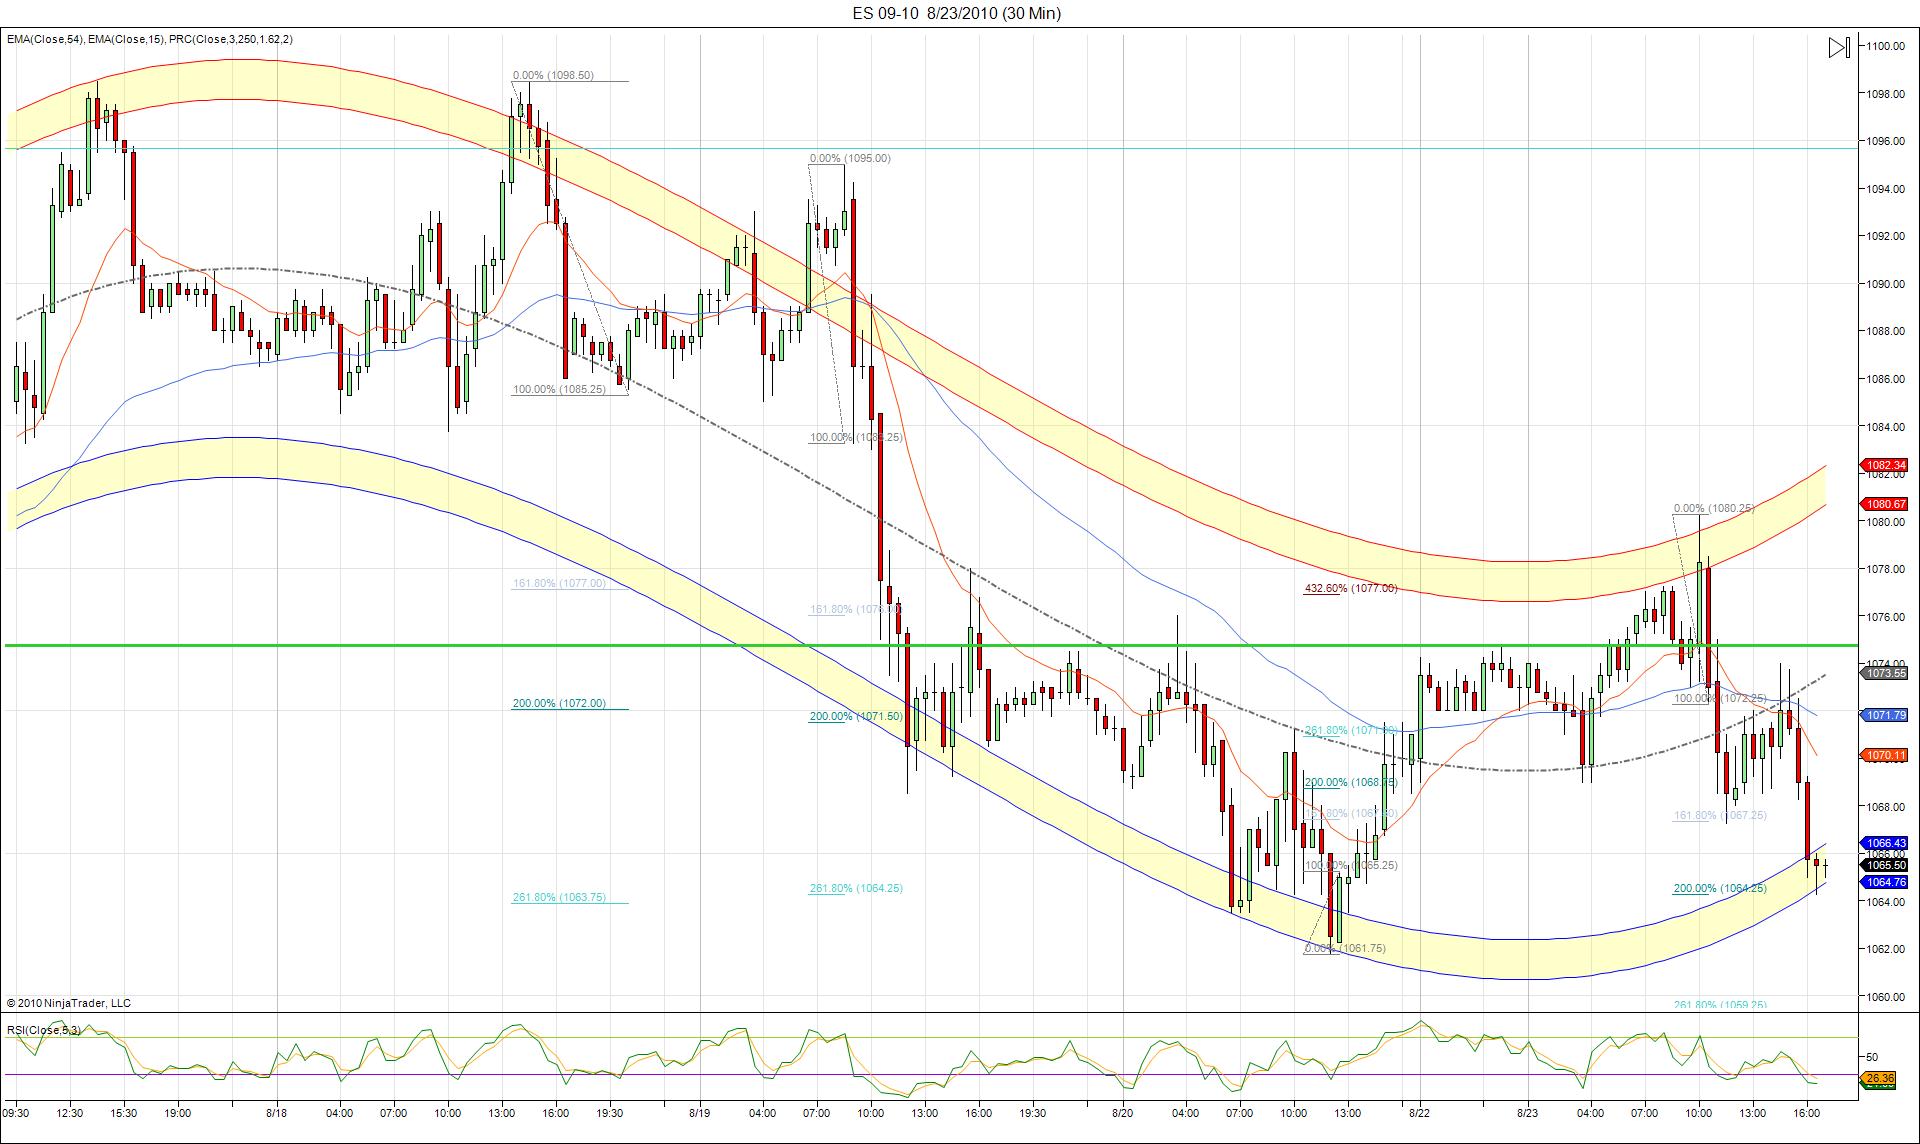
Stepped out for the afternoon so didn't get to comment on the action. Here is 30min PRC Band with fib projections. 1064.25 is looking like serious resistance based on previous visits, however, eventually it could give and the next level down is 1060-1059.25 area and below that 1045.75-1044.25. We saw some serious selling late afternoon today in terms of volume hitting bids. We finished with a reading of -74914 and we have now had three days in a row of negative readings (-79k, -37k, -75k). Where are the buyers going to step in or are we just seeing day trading buying which keeps getting overwhelmed by larger selling? I'm not smart enough to figure that one out...
The action in bonds is really telling us (imo) the economy is going to get worse, not better.
The action in bonds is really telling us (imo) the economy is going to get worse, not better.
Click image for original size
Yea, and its back to school season this week. Off to college, boarding school, naughty school, high school or wherever. Maybe September will bring back the volume.
Cheers!
Cheers!
Originally posted by MonkeyMeat
Hey Bruce and Lorn, maybe, with the August slow/no volume (non)activity, no one's really doing much but puttering around "browsing." I know I've reeled in my stock trading quite a bit lately (yawn). Btw, the info you deleted was interesting. If anyone's trading or analyzing ES out there (I'm currently equity focused), vote some good posts up and toss out an idea for what ya may be seeing. Just a thought.
Good stuff Guys!
Originally posted by BruceM
It's sad to think that out of the 300 or 400 views this thread has had that NOBODY could of helped us out with Their POC as per volume from last week...?I'm deleteing my last two posts...as it can't all be so one - sided on these boards...we need more giving and less taking....so I can't continue to share things I'm working hard at...I'll stick to posting the ideas that still work but keep the newer ones to myself and emails...Originally posted by BruceM
mine is based on Volume too....sometimes scaling can be an issue but perhaps mine is off due to IB's dealing with volume...anyway make sure you have it in .25 increments..sometimes to fit on a screen I scale it too .50 and it messes up my readings....not sure which one is right....perhaps someone else still reads these and can help out
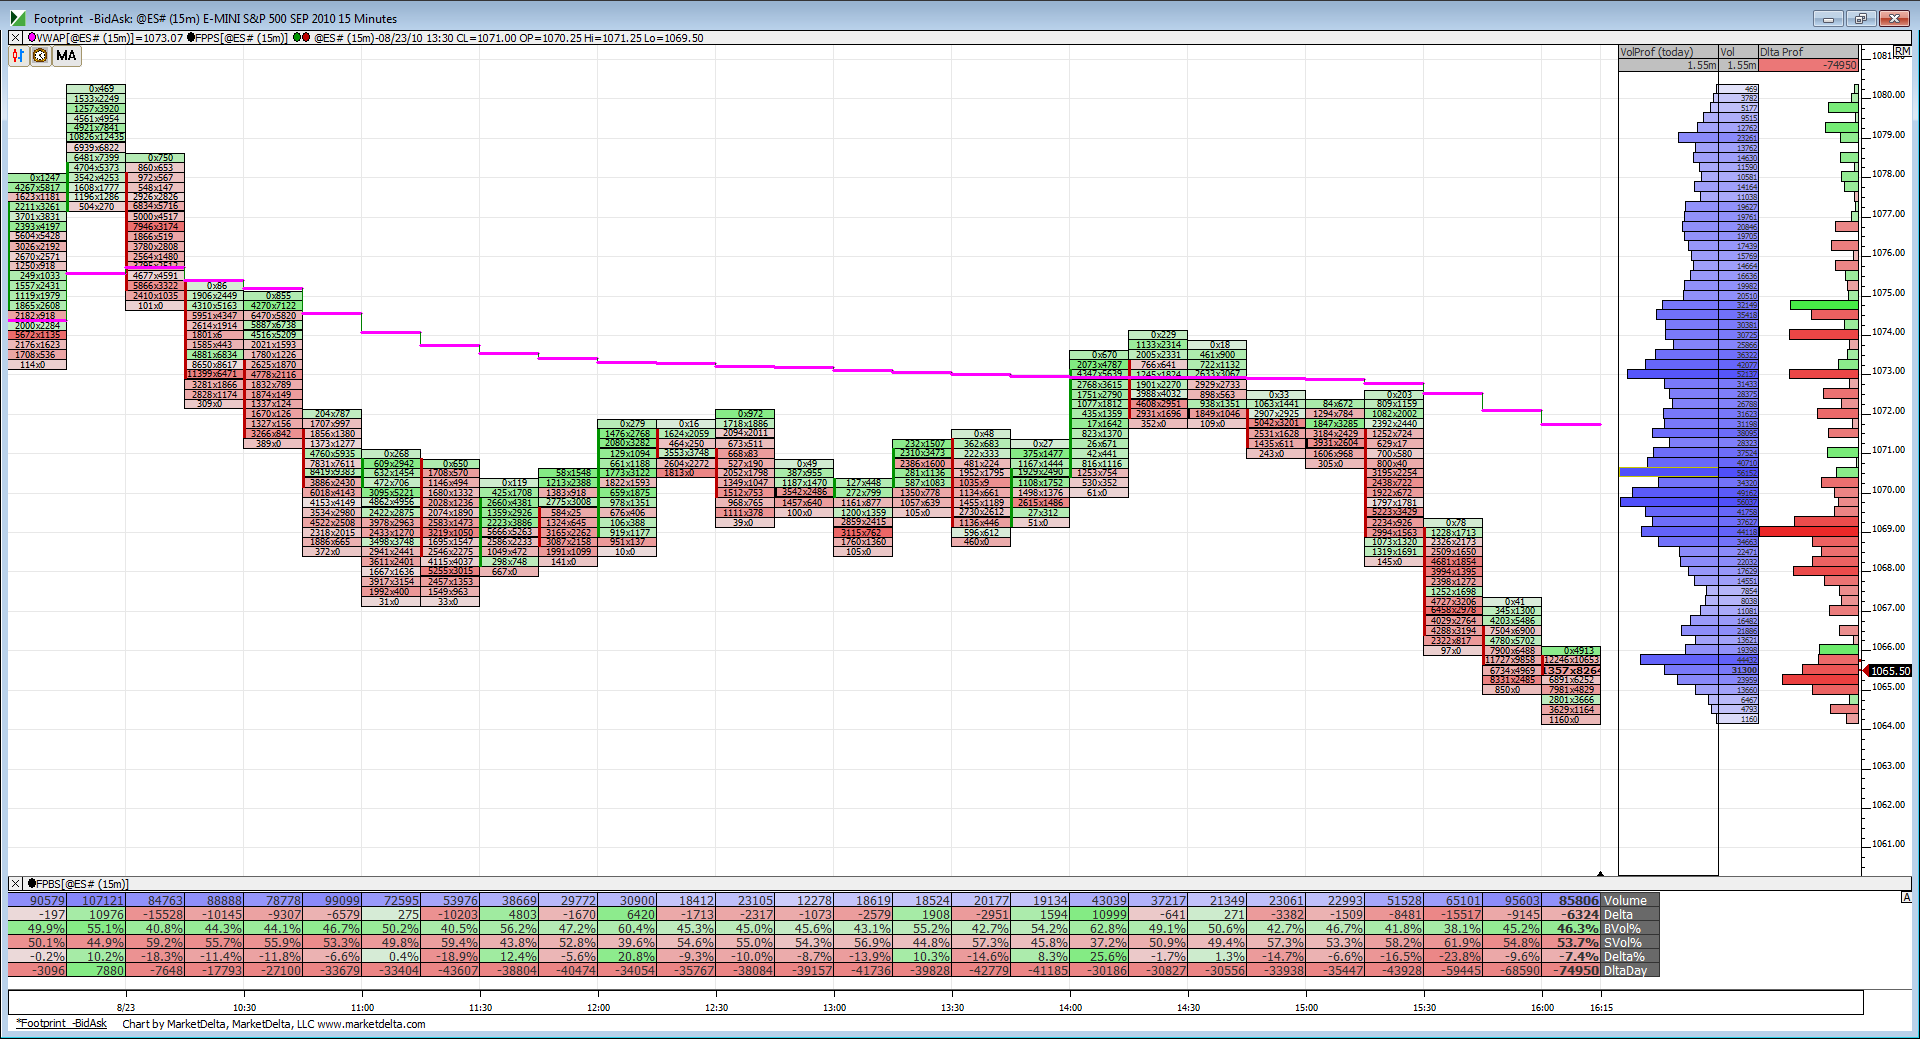
Here is the footprint chart with the negative delta I was talking about and you can see how VWAP was resistance.
Click image for original size
Originally posted by BruceM
It's sad to think that out of the 300 or 400 views this thread has had that NOBODY could of helped us out with Their POC as per volume from last week...?I'm deleteing my last two posts...as it can't all be so one - sided on these boards...we need more giving and less taking....so I can't continue to share things I'm working hard at...I'll stick to posting the ideas that still work but keep the newer ones to myself and emails...Originally posted by BruceM
mine is based on Volume too....sometimes scaling can be an issue but perhaps mine is off due to IB's dealing with volume...anyway make sure you have it in .25 increments..sometimes to fit on a screen I scale it too .50 and it messes up my readings....not sure which one is right....perhaps someone else still reads these and can help out
I enjoy all the posts Bruce! I am learning new tricks, but I am not able to assimilate all the info you are keeping in the air in a manner to benefit my trading.
I need to trade with my eyes. Support/Resistance, breakouts and pullbacks. That's enough for me to handle. LOL!. I would love to be able to process the data as well as you and others do, maybe someday.
Good trading to all.
FWIW, my eyes see a lot of support at 1061-1063 area based on closes in mid July. First retest of those areas.
Emini Day Trading /
Daily Notes /
Forecast /
Economic Events /
Search /
Terms and Conditions /
Disclaimer /
Books /
Online Books /
Site Map /
Contact /
Privacy Policy /
Links /
About /
Day Trading Forum /
Investment Calculators /
Pivot Point Calculator /
Market Profile Generator /
Fibonacci Calculator /
Mailing List /
Advertise Here /
Articles /
Financial Terms /
Brokers /
Software /
Holidays /
Stock Split Calendar /
Mortgage Calculator /
Donate
Copyright © 2004-2023, MyPivots. All rights reserved.
Copyright © 2004-2023, MyPivots. All rights reserved.