ES Short Term Trading 9-1-10
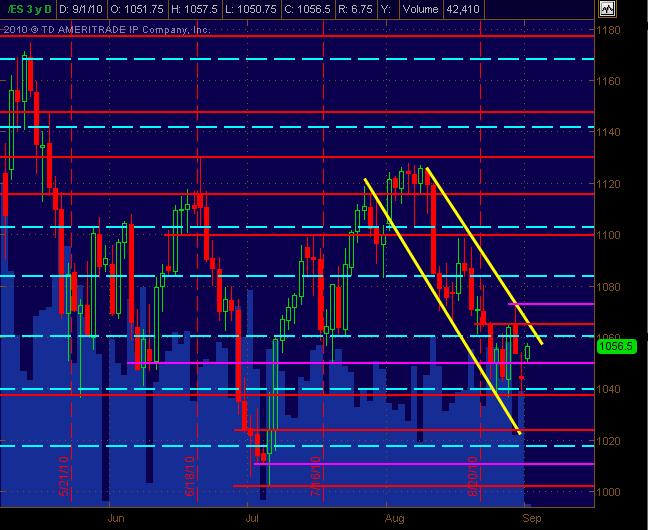
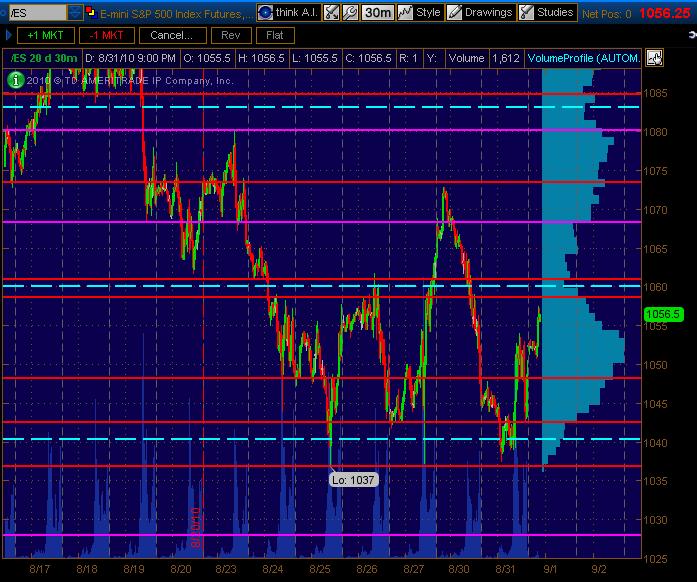
Have a daily and 30min chart with price action S/R levels on both ... Red = potentially significant ... Magenta = potentially semi-significant. The Cyan dashed lines are Wkly Pvt Levels. This is just a map.
Hope this is helpful ... am not liking TOS after a few months of digging around in it ... but this is where the charts are pulled from for now.
The Intermittent Funky Monkey
Click image for original size
Click image for original size
Hope this is helpful ... am not liking TOS after a few months of digging around in it ... but this is where the charts are pulled from for now.
The Intermittent Funky Monkey
Lets take a look at the footprint after the first hour. We all can see the break away from VWAP. The interesting thing now is the build up of volume in this 1074 area.
Click image for original size
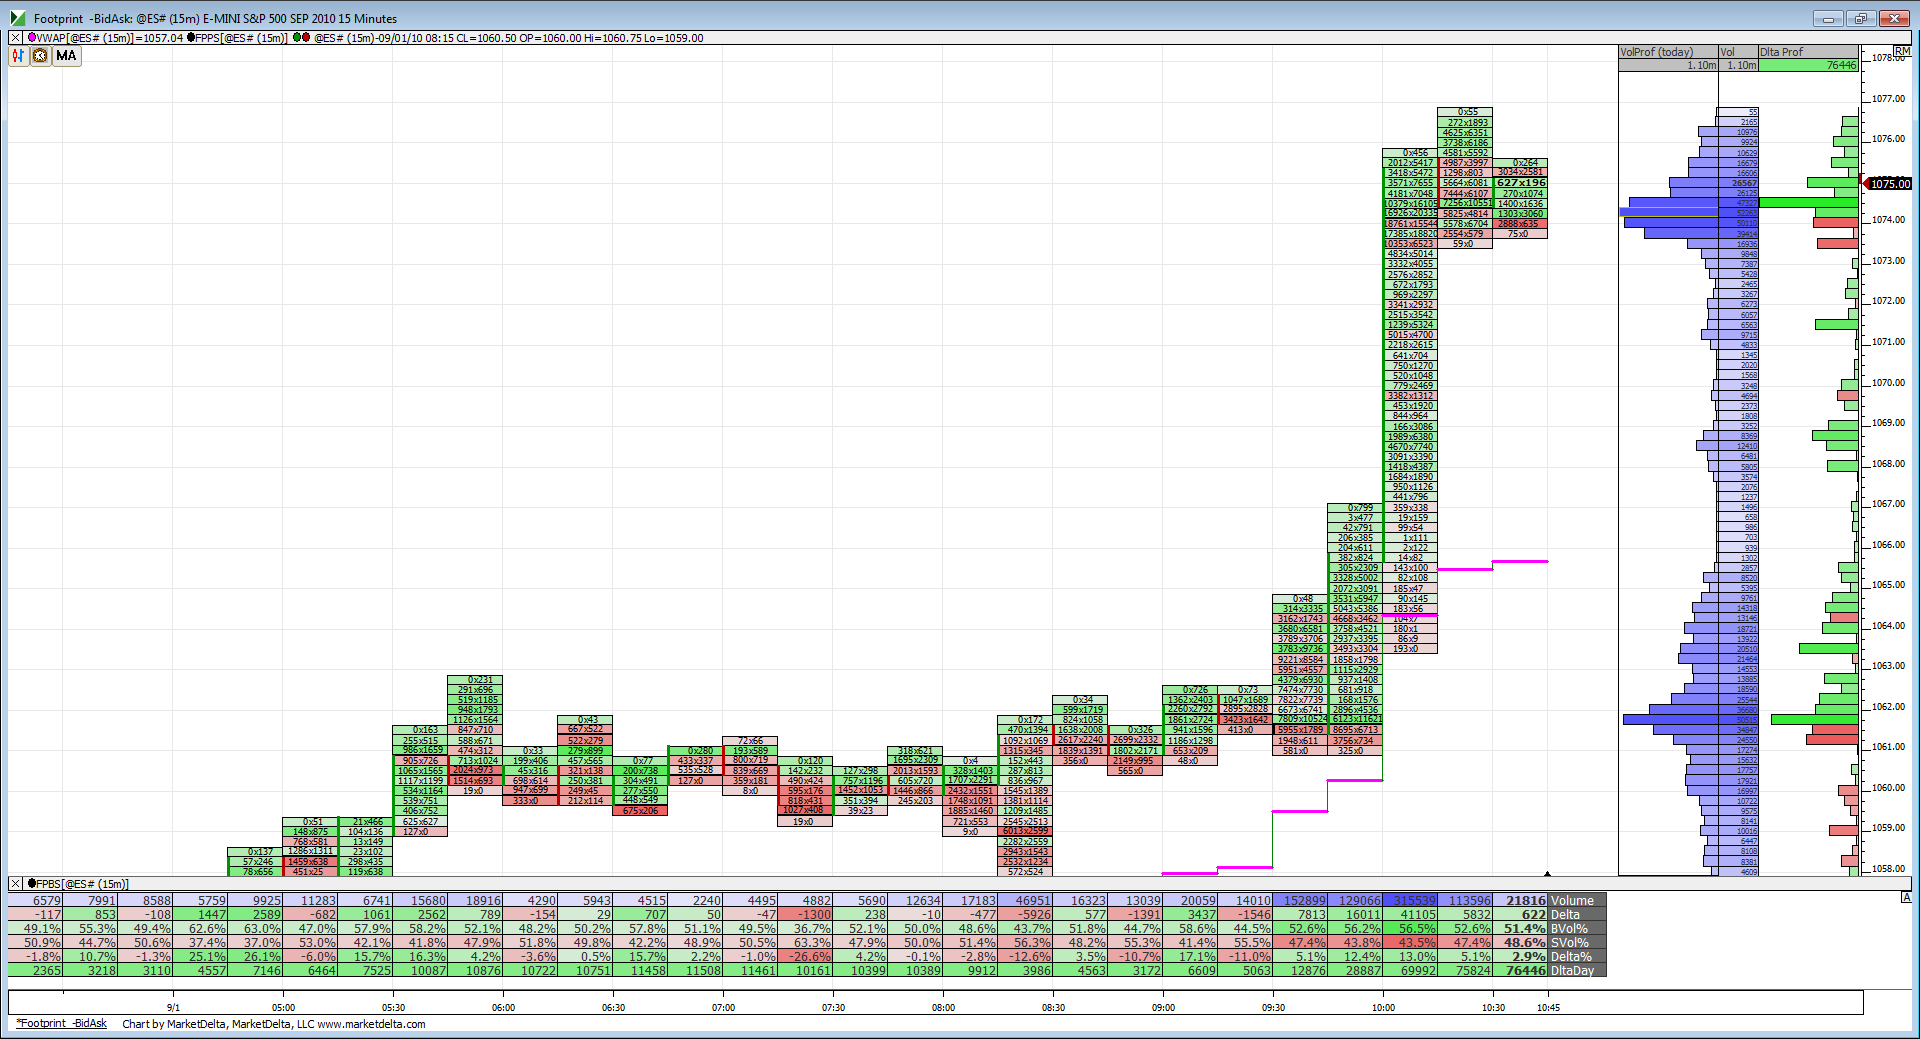
1074 was August Pivot Point (calculated using July's prices)
I mentioned this before, but I'll mention it again.
I did studies of Monday price ranges with fib extensions.
Once price hits a .618 extension of Monday's range, odds are heavily weighed that price will hit a full 1* Monday's range (Monday's RTH range added to Monday's RTH H or subtracted from Monday's RTH Low)
I call .618 extension (H-L) * .618) + Monday H, but if you use a fibbo charting tool it will be labeled 1.618 or 161.8% extension because the "1" represents the range itself. the 1* range extension would be labeled 2.000 or 200% on a fib tool.
anyway... one full extension of Monday's range above Monday's H = 1082.50, and as I say (barring a catastrophic headline) odds are high that this will be printed either later this afternoon or tomorrow.
stall in price likely now intraday as price has just hit daily 20period sma (1078.56).
that's it for me today... good luck trading.
woops,
I guess I should have mentioned that the 618 extension up of Monday's range was 1075.25
full extension is 1082.50.
I guess I should have mentioned that the 618 extension up of Monday's range was 1075.25
full extension is 1082.50.
I have shorts at 73.75 and 77.50...weighted heavier on back end.....I know that 79 - 80 is next key price they will push for if this is gonna trend....add on was at hour breakout and so far they seem to be accepting these higher prices
seems like we are gonna see those volume surges to run everyone out soon.........I'm assuming they will try to hold it up to suck in the lunch crowd.....like your grannies and moms and dads at home and at the office who are taught to buy strength
Gaps in the data up top at 77.75...
seems like we are gonna see those volume surges to run everyone out soon.........I'm assuming they will try to hold it up to suck in the lunch crowd.....like your grannies and moms and dads at home and at the office who are taught to buy strength
Gaps in the data up top at 77.75...
eating this loser at 76.50...ticks too strong for this one
79.50 - 80 BEGINS the low volume area I thought woukd trade if 51 - 55 held at the begining of the week.....last chance for a fade is there as they will either blow thorugh it quick or sell it off from there
biggest surprise for me so far is the lack of any real test of the 70 - 71 area....usually when we rocket through a POC of Volume there is at least a Retest attempt...like the try earlier to re-tag the 60.50 number...
Lots of reports tomorrow and hurricanes coming....I couldn't buy up here...the fader in me is too strong!! I'd rather miss the move when so far extended....so I'm still hunting shorts..
Lots of reports tomorrow and hurricanes coming....I couldn't buy up here...the fader in me is too strong!! I'd rather miss the move when so far extended....so I'm still hunting shorts..
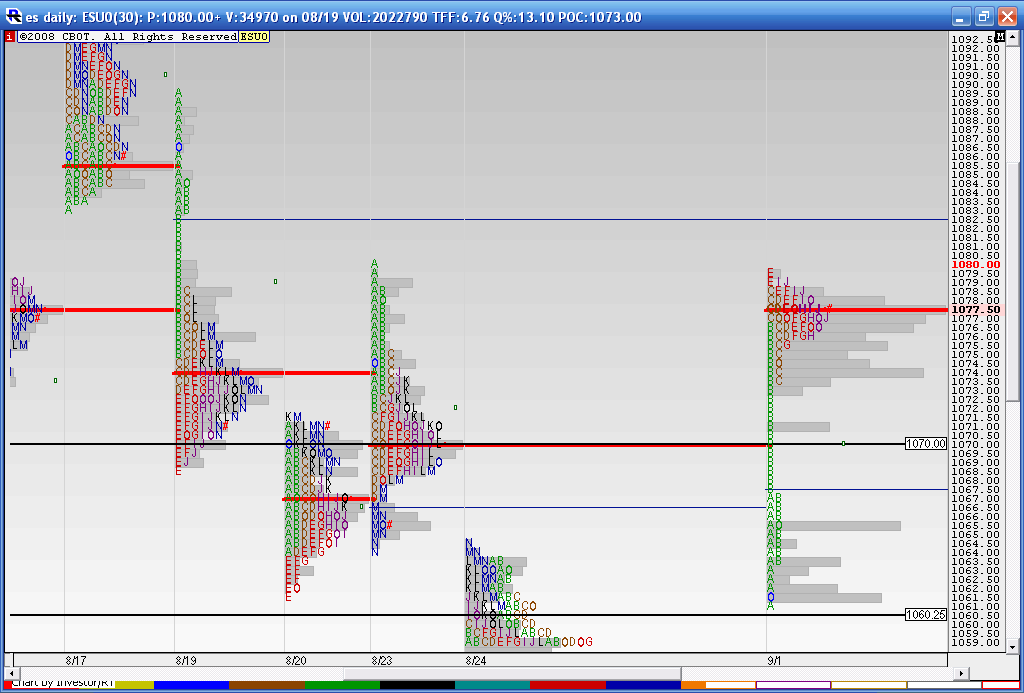
Nice Paul..thanks for that reminder...new ideas are hard to remember sometimes...Your 82.50 lines up with the single print breakdown from 8-19...chart to follow
Originally posted by PAUL9
1074 was August Pivot Point (calculated using July's prices)
I mentioned this before, but I'll mention it again.
I did studies of Monday price ranges with fib extensions.
Once price hits a .618 extension of Monday's range, odds are heavily weighed that price will hit a full 1* Monday's range (Monday's RTH range added to Monday's RTH H or subtracted from Monday's RTH Low)
I call .618 extension (H-L) * .618) + Monday H, but if you use a fibbo charting tool it will be labeled 1.618 or 161.8% extension because the "1" represents the range itself. the 1* range extension would be labeled 2.000 or 200% on a fib tool.
anyway... one full extension of Monday's range above Monday's H = 1082.50, and as I say (barring a catastrophic headline) odds are high that this will be printed either later this afternoon or tomorrow.
stall in price likely now intraday as price has just hit daily 20period sma (1078.56).
that's it for me today... good luck trading.
Bulls and bears fighting it out over 77.50...here is my MP chart which shows that single print of 82.50 and the 70 we blew right through....so far!! The 70 was from 8-23..
Click image for original size
Originally posted by BruceM
biggest surprise for me so far is the lack of any real test of the 70 - 71 area....usually when we rocket through a POC of Volume there is at least a Retest attempt...like the try earlier to re-tag the 60.50 number...
Lots of reports tomorrow and hurricanes coming....I couldn't buy up here...the fader in me is too strong!! I'd rather miss the move when so far extended....so I'm still hunting shorts..
Same here! Holding short from 1077.75 looking for test of 1072 (prior highs from 8/29)
rburns:
The following is my interpretation of Paul9's findings...
On 30-Aug-2010 (Monday):
Hi = 1063.50
Lo = 1044.50
So, range = 1063.50 - 1044.50 = 19.00
So, 0.618 extension from Monday's Hi = 0.618*19.00 + 1063.50 = 1075.00 (rounded down from 1075.242)
Paul9 says that if price hits 1075.00 (as it happened today, i.e., 01-Sep-2010), then there is a high probability that the price will hit 1.000*19.00 + 1063.50 = 1082.50. Today, it did hit 1082.50.
Hope this helps.
Originally posted by rburns
Am I understanding this correctly? Take Mon H and L. Any .61 move off the bottom or top of the days range will produce a 1.61 move either higher or lower than the days range.
Emini Day Trading /
Daily Notes /
Forecast /
Economic Events /
Search /
Terms and Conditions /
Disclaimer /
Books /
Online Books /
Site Map /
Contact /
Privacy Policy /
Links /
About /
Day Trading Forum /
Investment Calculators /
Pivot Point Calculator /
Market Profile Generator /
Fibonacci Calculator /
Mailing List /
Advertise Here /
Articles /
Financial Terms /
Brokers /
Software /
Holidays /
Stock Split Calendar /
Mortgage Calculator /
Donate
Copyright © 2004-2023, MyPivots. All rights reserved.
Copyright © 2004-2023, MyPivots. All rights reserved.