ES Short Term Trading 9-21-10
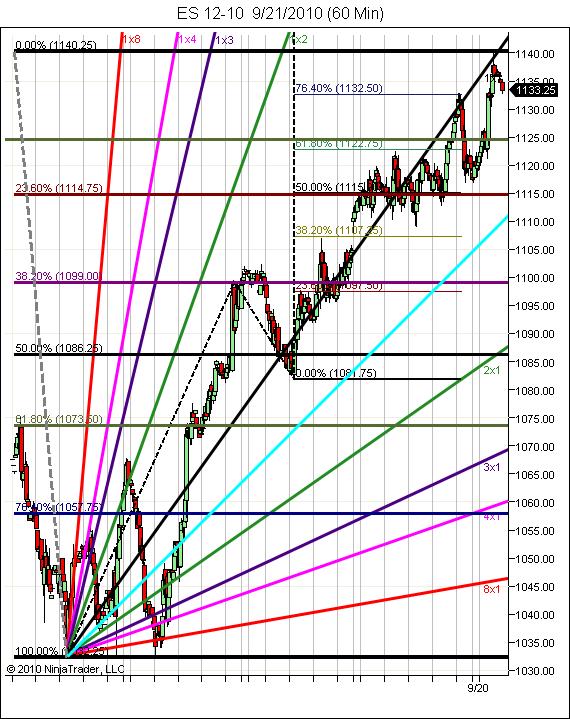
1137 hit and exceeded.It was the minimum target for a wave C up from 1035 and nothing more than 1137 is required of EW rules if indeed a C wave. However, an equal move for a C wave would equal an 1160 target.If that comes to pass, C waves can be larger than A waves and usually are equal to or greater than.(please reread the first sentence again).
I operate off of the thesis it's an ABC corrective move as that's the conservative analysis and keeps you safe. If this happens to be a 3rd wave of 5 up it will become apparent and one can operate from there.
Note the price action around the 1x1 Gann fan line(black diagonal). I treat this as I would a 50% horizontal S/R line. Above is strength and below is weakness. You can't say it hasn't been an attractor.
For up, I'd expect it has to break and hold or we get more advance while it clings to the line.
On the downside, O/N low here at intraday S level (and Friday hod) 1132.75 so far. Below is psychological 1130 level and former high 1124.5 area marked by extended green horizontal line. Under that is 1115 S/R level and the 23.6 retracement level from 1035 and also the 50% retrace for this wave up from 1081.75. Beneath it all is that gap at 1107.
Hope this helps!
[file]e59897bb o-58b1-4515-af03-c479aceda421[/file]
Click image for original size
A look at the footprint into the open. Its FED day today so that migh suggest range bound trade in the morning. You can see its a small range in O/N.
Click image for original size
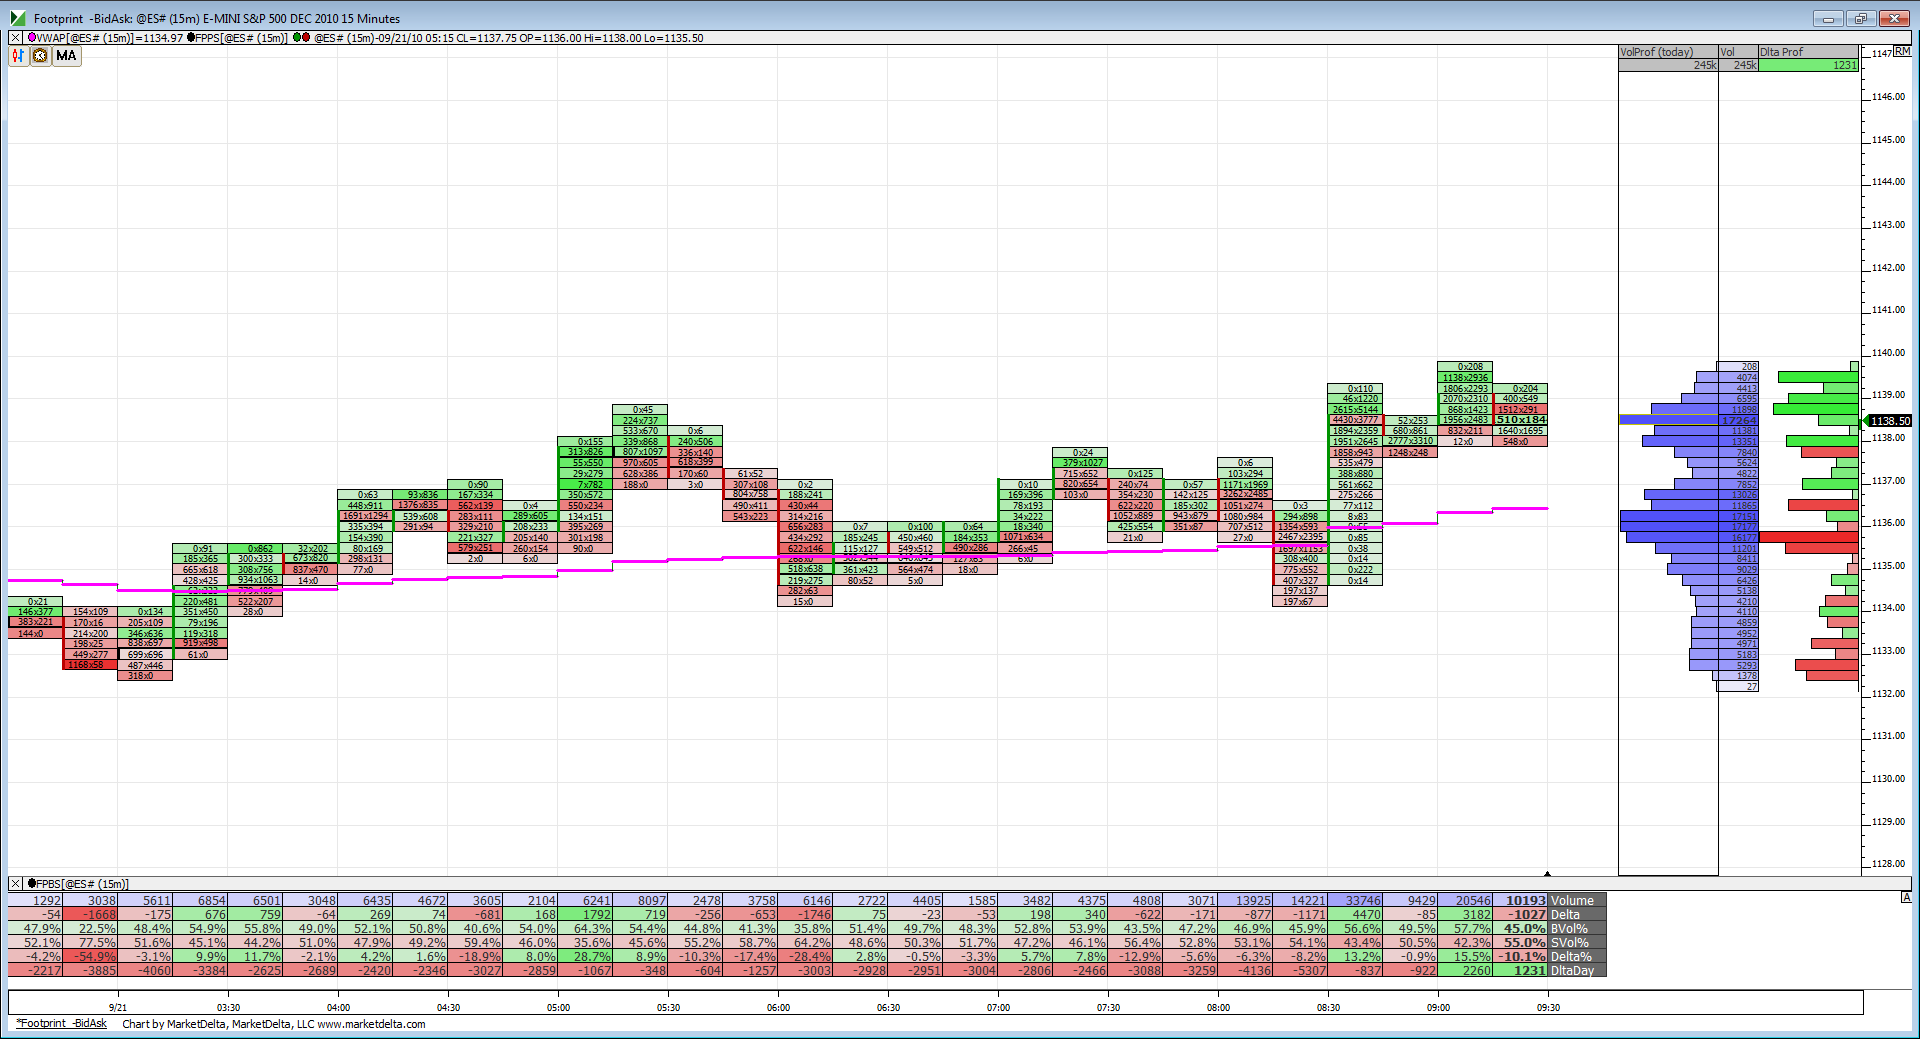
It's a Fed day but also a MATD environment as well ... so higher propensity for 2-sided trading and a range bound mkt.
this really is "two-sided trade"
2 tics to one side and 2 tics to the other side.
ugh.
2 tics to one side and 2 tics to the other side.
ugh.
haha!
I suppose there are some traders who actually enjoy this kind of PA.
I suppose there are some traders who actually enjoy this kind of PA.
Originally posted by PAUL9
this really is "two-sided trade"
2 tics to one side and 2 tics to the other side.
ugh.
Big move yesterday. relative to the first fifteen minutes of trading, Close was over 3.22 times first 15min range added to first fifteen minute H. (3.22 is roughly 2 * 1.618)
I went back and looked over the past 4 months, what happened yesterday was rare, but one thing I did notice, there is a tendency for price today to reach up in the RTH and eclipse yesterday's RTH H, which was 1140.25.
a similar day to yesterday in terms of the pattern of price in a 5minute RTH only chart was 7-7-10, the following day, price did eclipse the 7-7-10 H, but only after drifting lower and tagging, slightly undercutting a rising 100 period SMA (on 5 minute RTH only chart).
current 100 period SMA for today is rising and is about 1134,
There are several potential magnets with 32 handle
32.75 was H of last week (often first break above a weekly high has to come back and confirm buying interest)
32.25 was yesterdays price only POC
32.25 was O/N L
magnets work when they work. if price gets down to these "32" magnets you would still need to see PA supportive of a reversal (like a DB, or a 1-2-3) but run up could be nice. need price pattern confirm.
woops,
should have added,
that 5 day average of H vs Open and L versus Open I run,
for today average H vs Open comes in at 1146.50,
5 day average of L vs Open comes in today at 1133.50.
should have added,
that 5 day average of H vs Open and L versus Open I run,
for today average H vs Open comes in at 1146.50,
5 day average of L vs Open comes in today at 1133.50.
Interesting that 1134 is currently the 2nd standard deviation band below VWAP which also tends to be the extremes on both sides of VWAP during range bound days. Range traders will enter fades at these bands.
Originally posted by PAUL9
current 100 period SMA for today is rising and is about 1134,
There are several potential magnets with 32 handle
flat on final at 33.75...that's where the move began and the volume....
Man, how I love trading..........SOMETIMES!!!
Man, how I love trading..........SOMETIMES!!!
Emini Day Trading /
Daily Notes /
Forecast /
Economic Events /
Search /
Terms and Conditions /
Disclaimer /
Books /
Online Books /
Site Map /
Contact /
Privacy Policy /
Links /
About /
Day Trading Forum /
Investment Calculators /
Pivot Point Calculator /
Market Profile Generator /
Fibonacci Calculator /
Mailing List /
Advertise Here /
Articles /
Financial Terms /
Brokers /
Software /
Holidays /
Stock Split Calendar /
Mortgage Calculator /
Donate
Copyright © 2004-2023, MyPivots. All rights reserved.
Copyright © 2004-2023, MyPivots. All rights reserved.