ES Short Term Trading 9-24-10
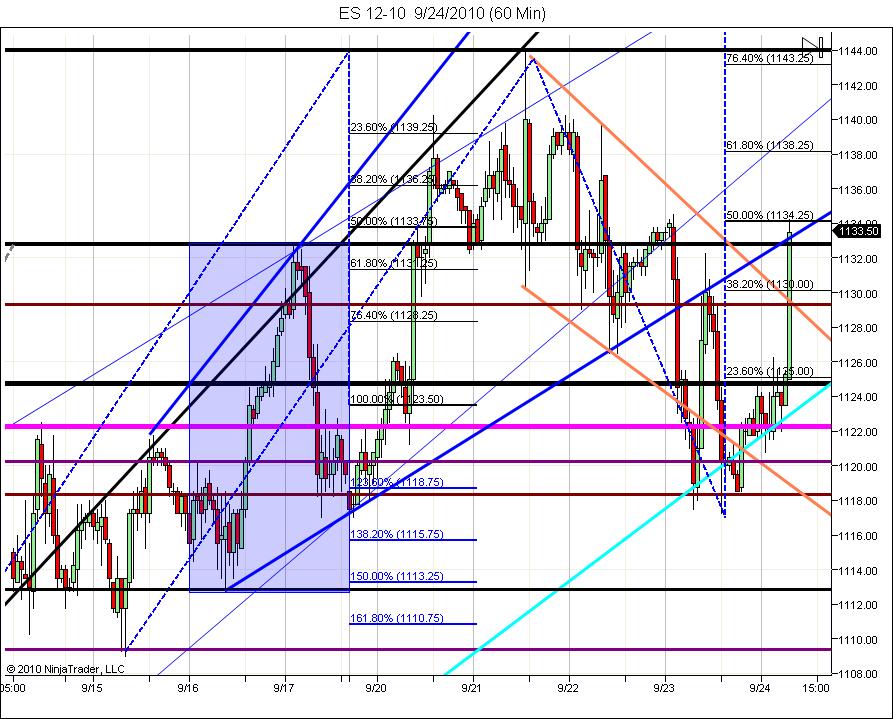
Already broke yesterdays high and my downtrend line quickly.. Things like this can happen when you don't break 1117.
Thick black line at 1124.75 is the former high previously known as 1129 on the old contract.I think we all know the other levels. 1100 or 1160?
Thick black line at 1124.75 is the former high previously known as 1129 on the old contract.I think we all know the other levels. 1100 or 1160?
Click image for original size
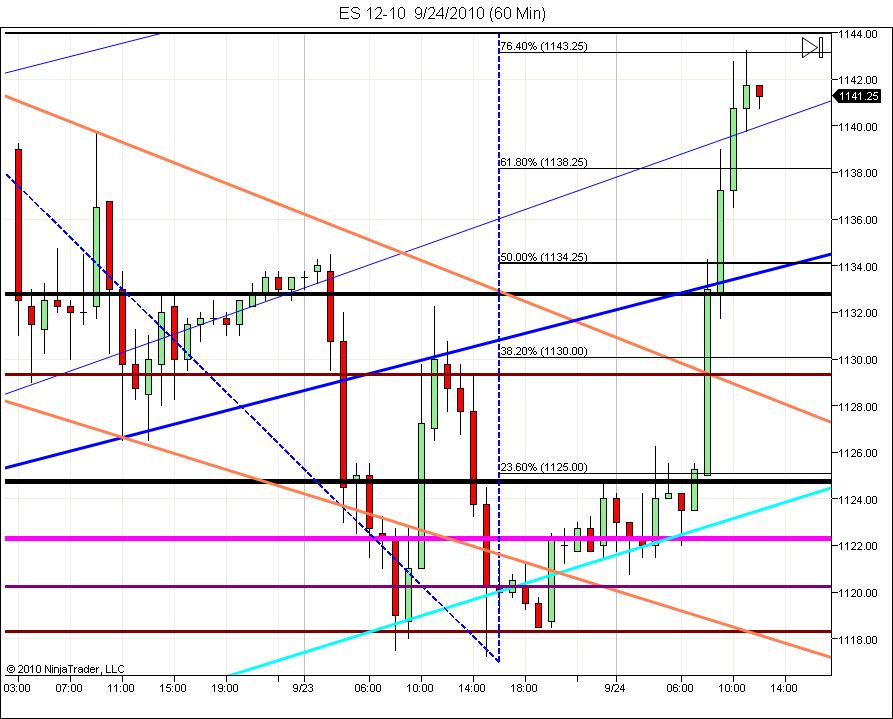
Red to doji to green with about 5 min left
1140.75 the pivot if you're watching
1140.75 the pivot if you're watching
There was no call made......? where? I don't see it.....show me...
Did I pick a bad week to quit sniffing glue??
Forums are so strange!!
Did I pick a bad week to quit sniffing glue??
Forums are so strange!!
Originally posted by luckytwelve
Hey, I was asked for a call 'in the moment' or 'before the fact', so don't vote me down for throwing one out there. tough crowd.
Orignally posted by luckytwelve at 44 past the last hour...
"that was a nice move, we'll see if the afternoon brings more."
Was...as in 'no more'.
Are we O/T in discussing that? Too funny.
"that was a nice move, we'll see if the afternoon brings more."
Was...as in 'no more'.
Are we O/T in discussing that? Too funny.
Well that one went green with S now at 1140.75
see where the body formed
At least it's shorter with tails above.
1141.75 now the pivot.
still searching for at least one red bar
see where the body formed
At least it's shorter with tails above.
1141.75 now the pivot.
still searching for at least one red bar
Click image for original size
what ??? Oh I get it , your here to yank our chain......I don't see any numbers....ridiculous..I'll leave it at that
Originally posted by luckytwelve
Orignally posted by luckytwelve at 44 past the last hour...
"that was a nice move, we'll see if the afternoon brings more."
Was...as in 'no more'.
Are we O/T in discussing that? Too funny.
Hmmm...price at time...looks pretty clear to me. Nuff' said.
Ok, now that we settled that...
In my world the hour highs and lows are crucial....so far this is a number 5 entry ..A break of an hour high into a key number...and so far it isn't moving as fast as I would like it..down....so this entire zone up here is real important.
Hopefully most saw the test of the previous bracket low...( any educational value to anyone)..I'm not sure ..it may also be meaningless...but at least it is a repeatable concept and how you use it SHOULD always be up to the end reader....
Not sure why some want to waste our time....it's a real downer..
Dalton talks about the "P" profile and most times it is referenced in terms of a short covering rally....if you read MOM you will notice that he ALSO mentions that the "P" profile can also form at the upper end of a bracket....as the smart money is accumulating ( my theory) for a break of that bracket.
I'm just mentioning it so we can compare yesterdays "P" profile...which formed in the first 2/3 of the day with today. Yesterday we weren't at a bracket high that I could see. So far it seems that they want higher...from this "P" pattern
I'm just mentioning it so we can compare yesterdays "P" profile...which formed in the first 2/3 of the day with today. Yesterday we weren't at a bracket high that I could see. So far it seems that they want higher...from this "P" pattern
Ouch and out. sorry for the delay
might try again if they don't break the highs here but not going to make a career of this.
if they break, maybe a retest will be what I'm looking for.
1141.75 now S
might try again if they don't break the highs here but not going to make a career of this.
if they break, maybe a retest will be what I'm looking for.
1141.75 now S
very good chance they will push it over 43.50...no double tops today
Originally posted by redsixspeed
Friday close was above the 1140 which is the top of the zone it also closed above 1141 a key # for me...this was a weekly close as well so I am still looking for more up...gotta have a plan..
====================================================================
We made it to zone 1163.25/1167.50..this area is hit 80% 0f
the time...the next zone above is 1176.00/1180.00 and is hit
90% of the time....I view these as giant magnets...we seem
to have stalled at these areas...some say a reversal is near.
Its one thing to see a cluster of #s in an area...but if I know
how often the area is hit I have a better idea of market direction
Emini Day Trading /
Daily Notes /
Forecast /
Economic Events /
Search /
Terms and Conditions /
Disclaimer /
Books /
Online Books /
Site Map /
Contact /
Privacy Policy /
Links /
About /
Day Trading Forum /
Investment Calculators /
Pivot Point Calculator /
Market Profile Generator /
Fibonacci Calculator /
Mailing List /
Advertise Here /
Articles /
Financial Terms /
Brokers /
Software /
Holidays /
Stock Split Calendar /
Mortgage Calculator /
Donate
Copyright © 2004-2023, MyPivots. All rights reserved.
Copyright © 2004-2023, MyPivots. All rights reserved.