ES Short Term Trading 9-24-10
Already broke yesterdays high and my downtrend line quickly.. Things like this can happen when you don't break 1117.
Thick black line at 1124.75 is the former high previously known as 1129 on the old contract.I think we all know the other levels. 1100 or 1160?
Thick black line at 1124.75 is the former high previously known as 1129 on the old contract.I think we all know the other levels. 1100 or 1160?
Click image for original size
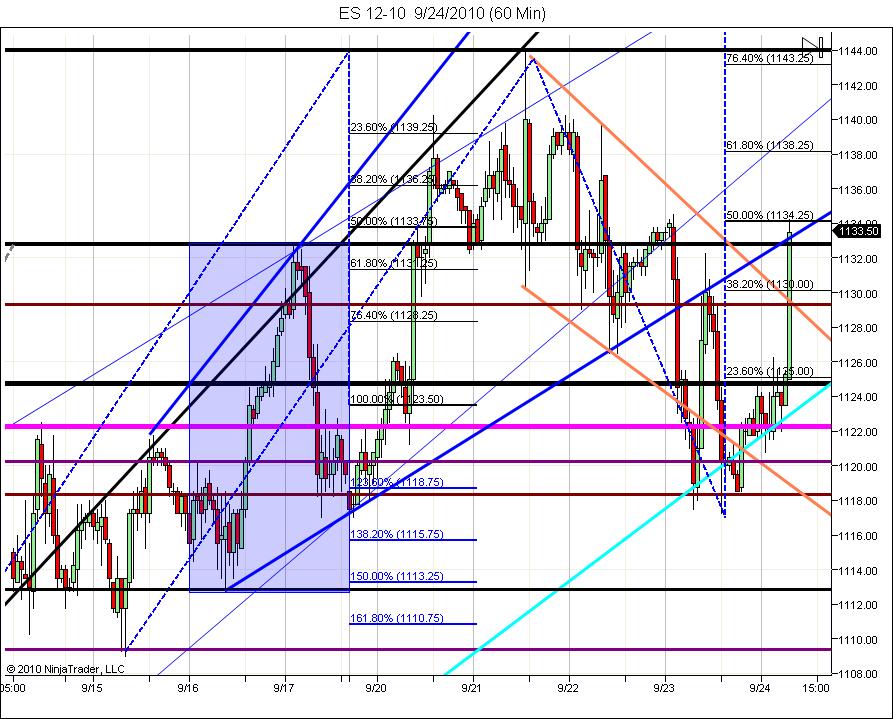
downside target would only be 1140 area
small only, can add later but looking to see if they ramp em
I see that double top
30 min chart has the red bar I;m looking for. would like to see one on the hourly. can;t always get what you want.
lunchtime over
small only, can add later but looking to see if they ramp em
I see that double top
30 min chart has the red bar I;m looking for. would like to see one on the hourly. can;t always get what you want.
lunchtime over
trading for the push out of highs
I'm the worlds worst trend trader...so no logical place for runner stops......Dang..that was quick...41 - 42 area seems too obvious for stop......without volume coming in above that high of Tuesday we aren't gonna go far
1143 the S line
flat at 43.25....damn good try but a bad day for runners....
With 4 campaigns today I took :
one lost campaign with my O/N trade and 3 winners and none of my runner contracts hit objectives today. The postive side is I am getting quicker at bailing out when fading trends. Still lots of work to do on that. It would be nice to just buy and hold but trends don't have a good track record and most can't flip to non-fading mode fast enough...including me!
So I'm still on my way to get better with trends but the real progress will be when I can actually take better long setups on trend up days...for now I'll settle for small wins and hopefully get better at avoiding the losses.
I'd like to get one more short on up her to target 41.50...that is high of low range 15 minute bar now
I'm thinking timing and 2 choices here.
A double top retreat to be taken out possibly later or about 10-20 more points today or Monday. This is the chance to ramp US markets with all other majors closed.
New highs for a lot of the power stocks today. Wouldn't take much to push em here. Doesn't seem as weird as yesterday.
2 hours
A double top retreat to be taken out possibly later or about 10-20 more points today or Monday. This is the chance to ramp US markets with all other majors closed.
New highs for a lot of the power stocks today. Wouldn't take much to push em here. Doesn't seem as weird as yesterday.
2 hours
see the red candle that closed on hourly chart
1143
1143
Click image for original size
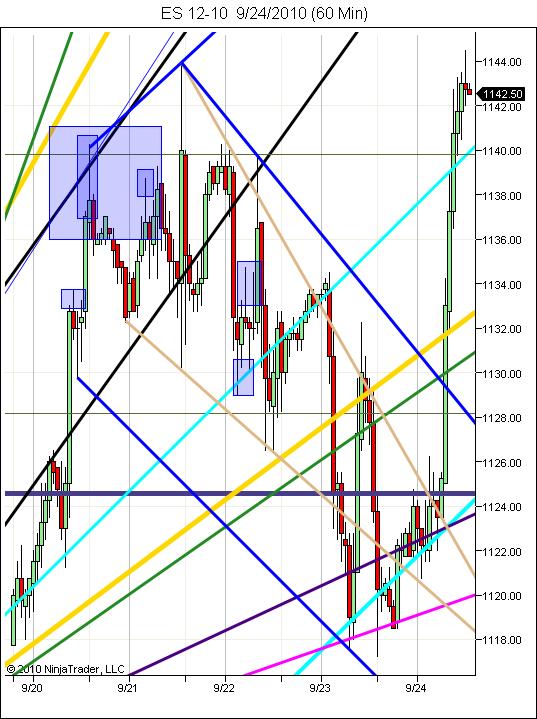
Interesting how we traded on both sides of the Monday - Tuesday range.....this is like a Neutral day but only on the weekly time frame...
We know that neutral days quit often close near their highs, lows or mid-range....LOL ! What about neutral weeks.....
To close in the middle would require ANOTHER sell-off like yesterday which doesn't seem likely but anything can happen
This volume up here is bothersome on that Tuesday Break...and volume now in general...is poor..I'll settle for the 41.50 if they'll give it and see what happens from there.....no longs for me...I'll miss that late day pop if it happens
they're getting gittery on that 41.50...I saw your hour David..thansk......
Originally posted by redsixspeed
Friday close was above the 1140 which is the top of the zone it also closed above 1141 a key # for me...this was a weekly close as well so I am still looking for more up...gotta have a plan..
====================================================================
We made it to zone 1163.25/1167.50..this area is hit 80% 0f
the time...the next zone above is 1176.00/1180.00 and is hit
90% of the time....I view these as giant magnets...we seem
to have stalled at these areas...some say a reversal is near.
Its one thing to see a cluster of #s in an area...but if I know
how often the area is hit I have a better idea of market direction
Emini Day Trading /
Daily Notes /
Forecast /
Economic Events /
Search /
Terms and Conditions /
Disclaimer /
Books /
Online Books /
Site Map /
Contact /
Privacy Policy /
Links /
About /
Day Trading Forum /
Investment Calculators /
Pivot Point Calculator /
Market Profile Generator /
Fibonacci Calculator /
Mailing List /
Advertise Here /
Articles /
Financial Terms /
Brokers /
Software /
Holidays /
Stock Split Calendar /
Mortgage Calculator /
Donate
Copyright © 2004-2023, MyPivots. All rights reserved.
Copyright © 2004-2023, MyPivots. All rights reserved.