Professional Training Seminars
Are there any professional training seminars out there that people can recommend for me to attend?
Try some of the free online webinars that are listed in the Trading Calendar
Also, the CME (www.cme.com) and CBOT (www.cbot.com) have a number of free webinars that can have some good material if you can sit through the whole hour that they usually take.
Good luck and let us know if you find any good ones...
Also, the CME (www.cme.com) and CBOT (www.cbot.com) have a number of free webinars that can have some good material if you can sit through the whole hour that they usually take.
Good luck and let us know if you find any good ones...
I'm thinking about going to the Professional Trading Summit in Vegas on November 15 & 16 in Las Vegas. Any one else going?
I am not but I was looking at it. I think that it's called the Futures Trading Summit and not the Professional Trading Summit.
I noticed that the price was heavily discounted recently which is usually the opposite direction that prices go when something like this is about to happen. i.e. Early birds get a discounted price not Late Birds. More details here: Futures Trading Summit
There's a good line-up of speakers going to be there: Paul Cherney, Yra Harris, Jim Wyckoff, Dominick Chirichella, Braden Janowski, Philip Klapwijk, Ben Van Vliet, Brett Steenbarger, Dan Gramza, Jim Dalton, Shelly Natenberg, John Carter, Michael J. Smith, Andy Bushak
I also think that it's sponsored by CME and CBOT.
I was looking to start a new topic then i decided to post here.
I decided to invest some time to learn Fibonacci lines to see If I can use them, but the net is full of this and that and it looks to me like their set after the fact, and knower it shows how to set them. I even spend some time at the CBOT webinars but again never mention how to set them. Any one knows how or knows of a link?
I decided to invest some time to learn Fibonacci lines to see If I can use them, but the net is full of this and that and it looks to me like their set after the fact, and knower it shows how to set them. I even spend some time at the CBOT webinars but again never mention how to set them. Any one knows how or knows of a link?
I created this online Fibonacci Calculator and put in as many levels as I could find that made sense and that I could find frequent references to. I have not however found any evidence to support them working or tested them. It seems that depending on where you start the lines and which of the lines that you use (i.e. which Fib numbers you look at) then you can justify or pick almost any support or resistance line on almost any time frame.
I do remember, however, on a much larger time frame when the market was running up after the peak in 2000 and the low in 2003 then everyone was talking about the 61.8% retracement and that worked almost to the tick as a resistance level on the way back up (S&P500) and I was surprised at how well that worked.
The question is, how would you test any of the numbers? I had a pretty difficult time testing pivot points because of the ambiguity as to the concept of "what works" - i.e. within 1, 2, or 3 points of the line. What works for a swing trader probably doesn't work for a day trader because the day trader would be stopped out but not the swing trader.
Thanks, I geve it a try.
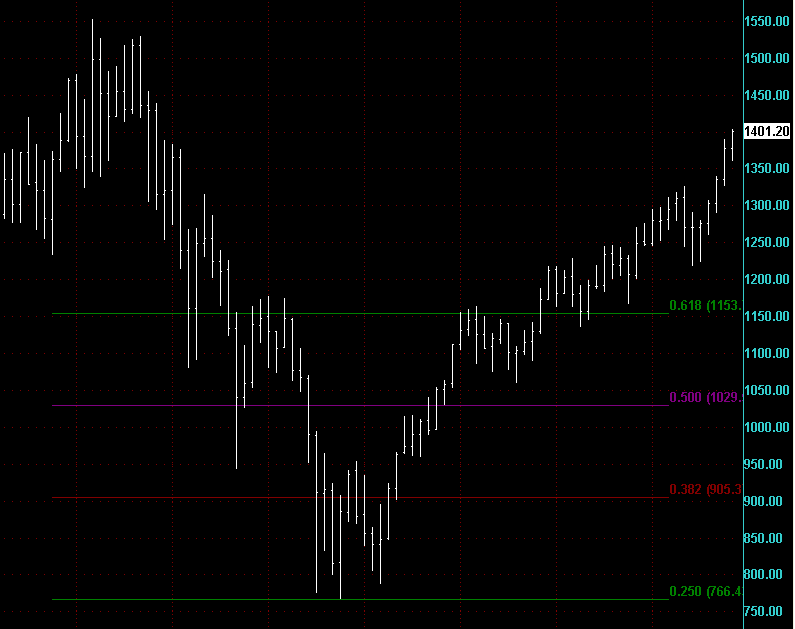
Trying out the MWSnap utility I captured this chart below. For some reason I can't change the color of the top line of my Fibonacci lines on my chart so it blends in with the black back ground. You can, however, see the 61.8% retracement from the bottom that I was talking about and that was certainly talked about as a resistance level for the S&P500 weeks before it hit there and so it could have been a self-fulfilling prophecy, which in itself is not a bad strategy.
Click image for original size
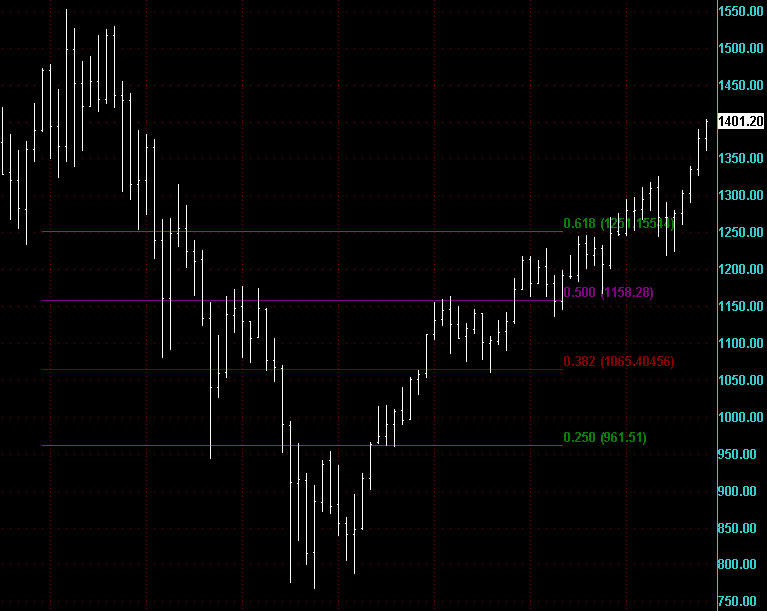
That last chart that I posted was wrong. It turns out the that bottom and top fib lines are colored black and missed the zero line. Here is the correct chart.
Click image for original size
quote:
Originally posted by day trading
I created this online Fibonacci Calculator and put in as many levels as I could find that made sense and that I could find frequent references to. I have not however found any evidence to support them working or tested them. It seems that depending on where you start the lines and which of the lines that you use (i.e. which Fib numbers you look at) then you can justify or pick almost any support or resistance line on almost any time frame.
I do remember, however, on a much larger time frame when the market was running up after the peak in 2000 and the low in 2003 then everyone was talking about the 61.8% retrasiment and that worked almost to the tick as a resistance level on the way back up (S&P500) and I was surprised at how well that worked.
The question is, how would you test any of the numbers? I had a pretty difficult time testing pivot points because of the ambiguity as to the concept of "what works" - i.e. within 1, 2, or 3 points of the line. What works for a swing trader probably doesn't work for a day trader because the day trader would be stopped out but not the swing trader.
You are right this Fib tool mite be something to use to check and see if your long play has legs or not or is going to retrace for that meter, for day trading the lines mite be to close to call the play.
Not necessarily too close but just not as predictive as people say that they are. With enough time and the right programming tools you could analyse several years of daily data and calculated what percentage retracements and/or extensions predicted support and resistance most often.
My fear is that after all of that work (and it would be a lot of work) you would end up with a probability table that showed an even distribution inside the previous high/low and taper effect on the outside which would confirm randomness of any one percentage working.
My fear is that after all of that work (and it would be a lot of work) you would end up with a probability table that showed an even distribution inside the previous high/low and taper effect on the outside which would confirm randomness of any one percentage working.
Check out my sig file for what i am finding the most useful resource online in the daytrading world!!
Emini Day Trading /
Daily Notes /
Forecast /
Economic Events /
Search /
Terms and Conditions /
Disclaimer /
Books /
Online Books /
Site Map /
Contact /
Privacy Policy /
Links /
About /
Day Trading Forum /
Investment Calculators /
Pivot Point Calculator /
Market Profile Generator /
Fibonacci Calculator /
Mailing List /
Advertise Here /
Articles /
Financial Terms /
Brokers /
Software /
Holidays /
Stock Split Calendar /
Mortgage Calculator /
Donate
Copyright © 2004-2023, MyPivots. All rights reserved.
Copyright © 2004-2023, MyPivots. All rights reserved.