ES Short Term Trading 10-15-10
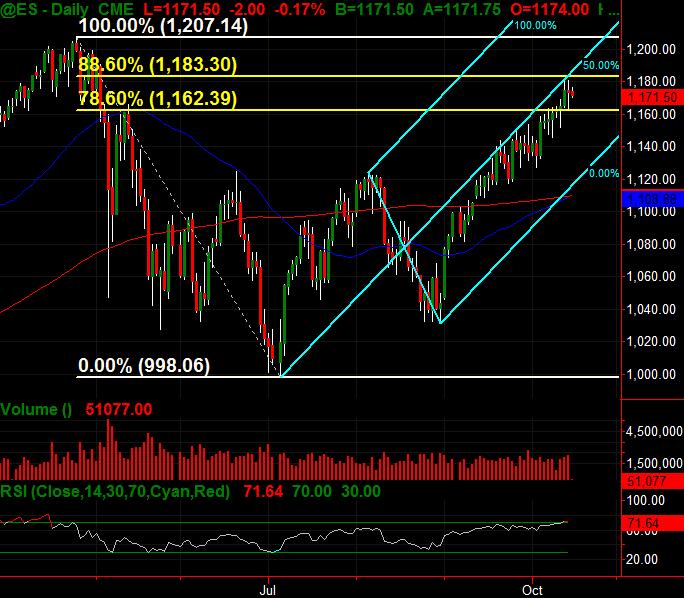
Here's what I've got with a Daily and 30 minute ES chart. The Daily is all-hours-trading with the yellow lines denoting the 786 and 886 fib retracements ... also in cyan is an Andrews Pitchfork that I've had drawn in for a week or two where price has been riding up the midline.
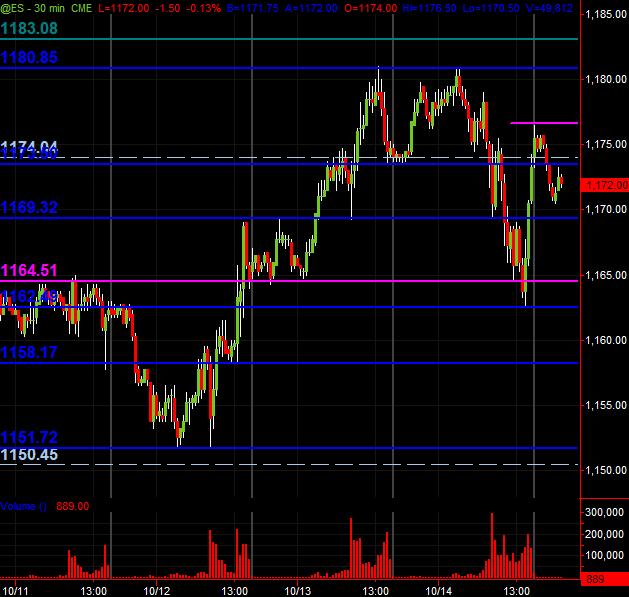
The 30 minute has the horizontal lines in Blue that denote potentially significant Price Action Support/Resistance areas. The Magenta lines are less significant. The horizontal cyan dashed lines are the Wkly Pivots.
This simply provides a map of the market for me. Hope, as always, that it's helpful to others.
Click image for original size
Click image for original size
Well my friends , I am afraid these threads have outlived there usefulness for me. We have 400 - 800 views a day but only 2 - 4 people posting. I get the feeling that most of us aren't learning too much anymore. Seeing the ideas used overtime was the main purpose and I think we have accomplished that.
The real key to any of this is being able to see the trades for yourself in realtime. Hopefully we have altered a few perceptions and have demonstrated overtime that it rarely pays to be a trend trader in the ES. I've picked up quite a few good ideas myself and now incorporate those when planning my trades.
I am thankful to all those who have given their time and effort here.
Bruce
Thanks for having kept this alive Bruce. I don't trade the ES but I have used this thread to help with my crude oil trading. Thanks to all who have posted and shared.
Yes many thanks go out to you Bruce for leading these threads. A pleasure getting to know you and all the other traders here. I'm sure we will figure out new ways to communicate ideas here on DT's great forum.
Cheers
Cheers
Emini Day Trading /
Daily Notes /
Forecast /
Economic Events /
Search /
Terms and Conditions /
Disclaimer /
Books /
Online Books /
Site Map /
Contact /
Privacy Policy /
Links /
About /
Day Trading Forum /
Investment Calculators /
Pivot Point Calculator /
Market Profile Generator /
Fibonacci Calculator /
Mailing List /
Advertise Here /
Articles /
Financial Terms /
Brokers /
Software /
Holidays /
Stock Split Calendar /
Mortgage Calculator /
Donate
Copyright © 2004-2023, MyPivots. All rights reserved.
Copyright © 2004-2023, MyPivots. All rights reserved.