ES S/R Map for 10-22-10
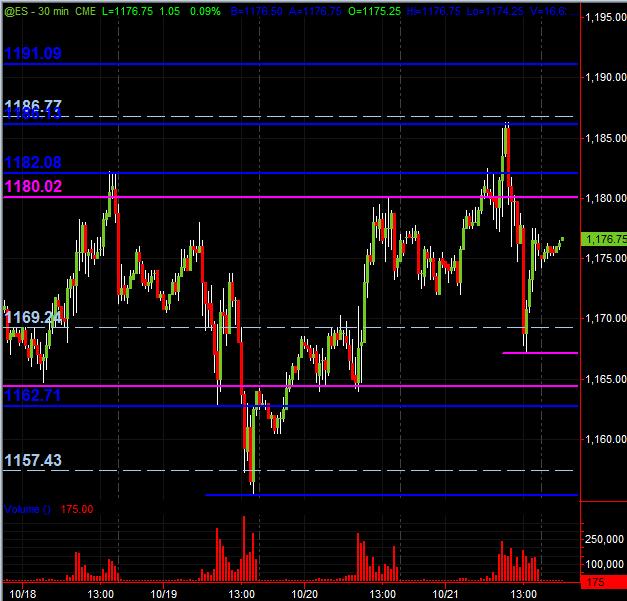
Here's what I've got for potential S/R levels for Friday's trading on the 30-minute chart (after also consulting the 5-minute and Daily charts). The Blue lines are the more significant price S/R "zones" with Magenta lines being semi-significant. The Light Blue dashed lines are simply the Wkly Pvt levels. As always, this is simply a map, my map, for coming into the trading day. Hope this is helpful.
Any and all comments and additional analysis as well as chart posting is not only welcome, but highly encouraged folks!
MM
Click image for original size
Any and all comments and additional analysis as well as chart posting is not only welcome, but highly encouraged folks!
MM
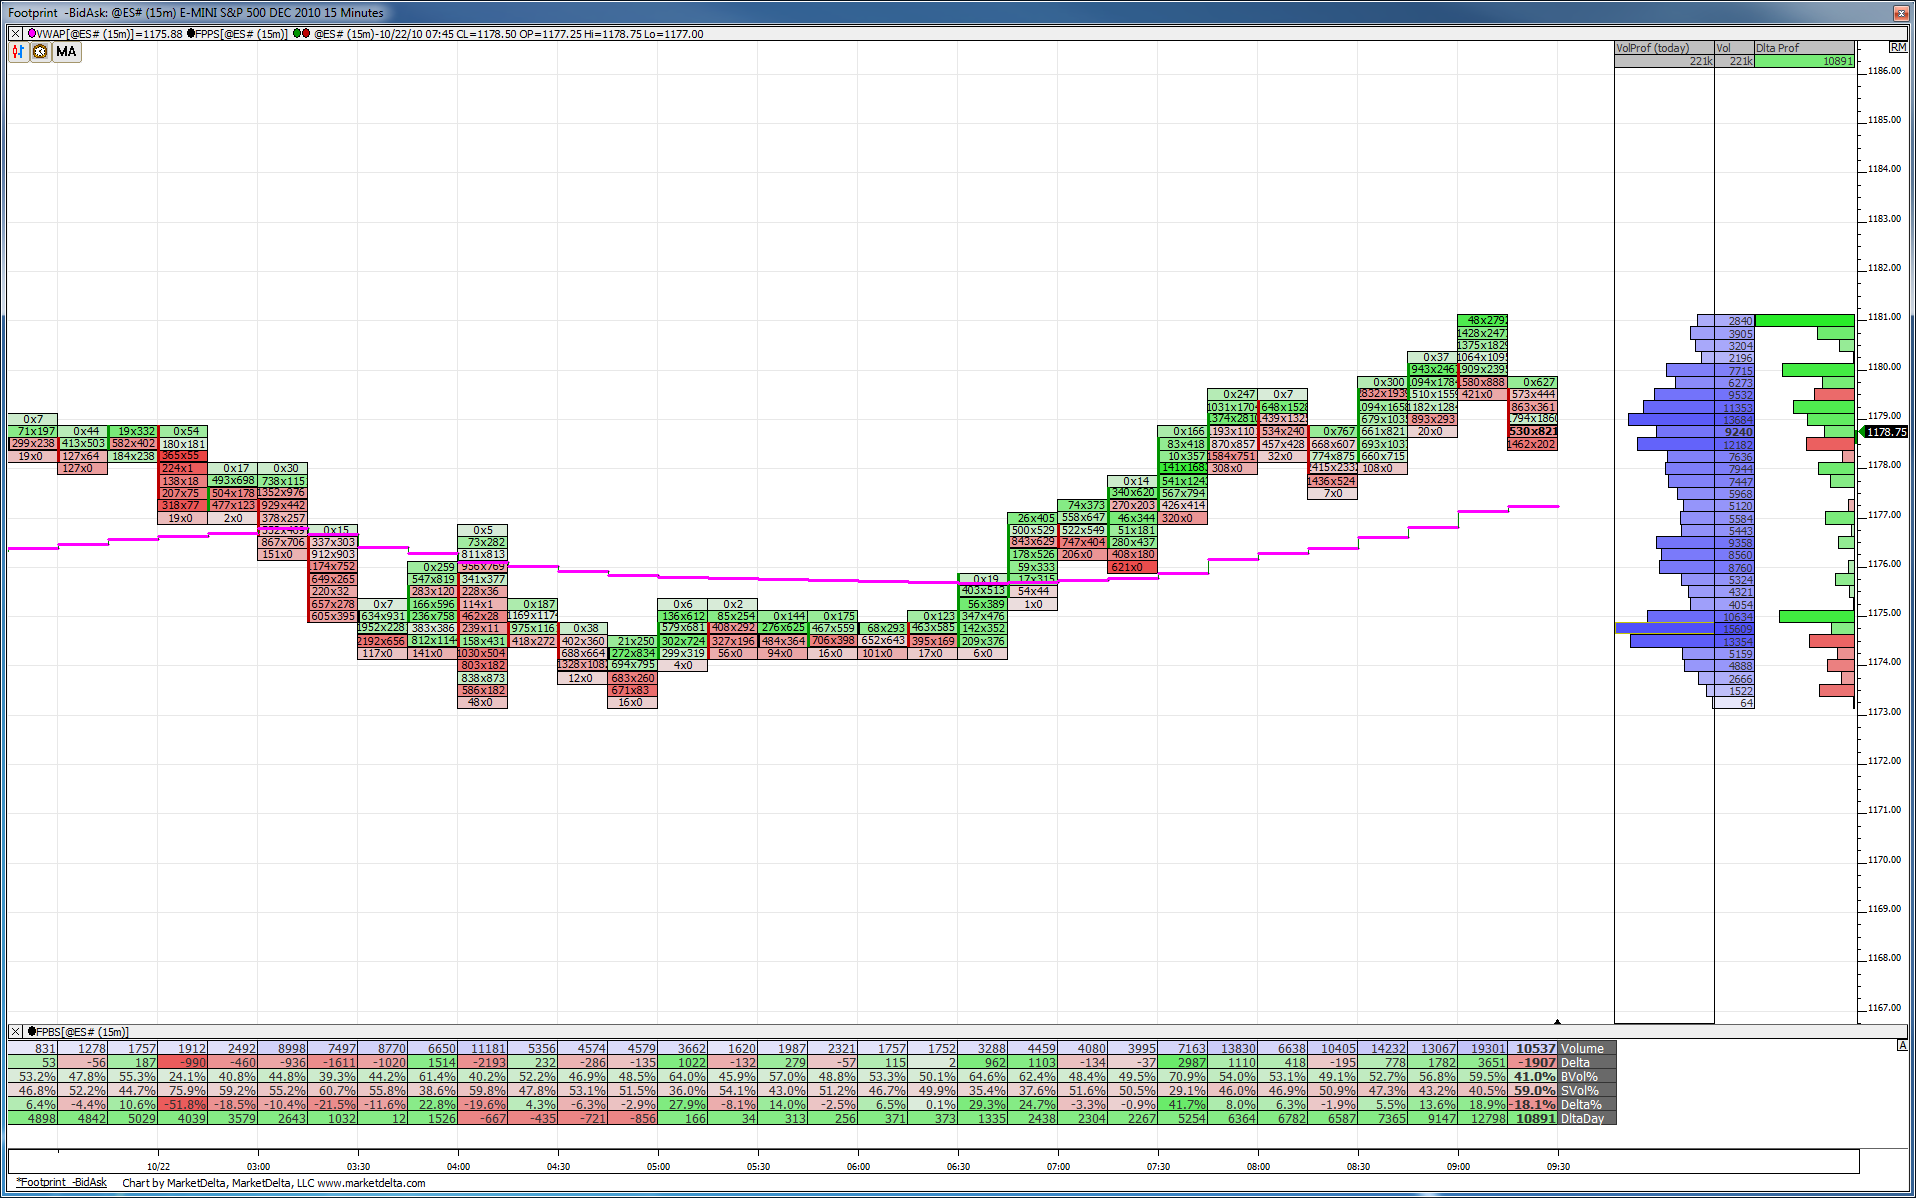
Footprint chart for the O/N action coming into RTH. Something jumping out at me is the obvious low volume at the O/N lows. According to Dalton's MP book this means a rejection of that area has taken place and the potential for this area to be future support should be realized. On the flip side, if the area gets taken out look for prices to move significantly away from the zone.
Click image for original size
thanks for taking time to initiate a thread
Lorn, I have a friend who uses investorRT and he told me that yesterday's H's were also Low volume.
RE volume at O/N lows, interesting, but how reliable is a measure of low volume in an overnight market?
Another thought just came to mind. I understand what you've said about low volume price rejection (Dalton) but what would the interpretation be if at the Lows the volume gates opened and those prices attracted huge volume?
Hi Paul,
You are spot on in questioning the strength of low volume zones from O/N action. The fact it is the O/N Low brings its importance up in the world. I mainly pointed it out for examples sake because its an easy one to see.
According to Dalton a high-volume zone is one where price slows down and spends time at, which can be used as targets for when a trade is on because price should slow down again within a high-volume zone allowing hassle free exit of a trade.
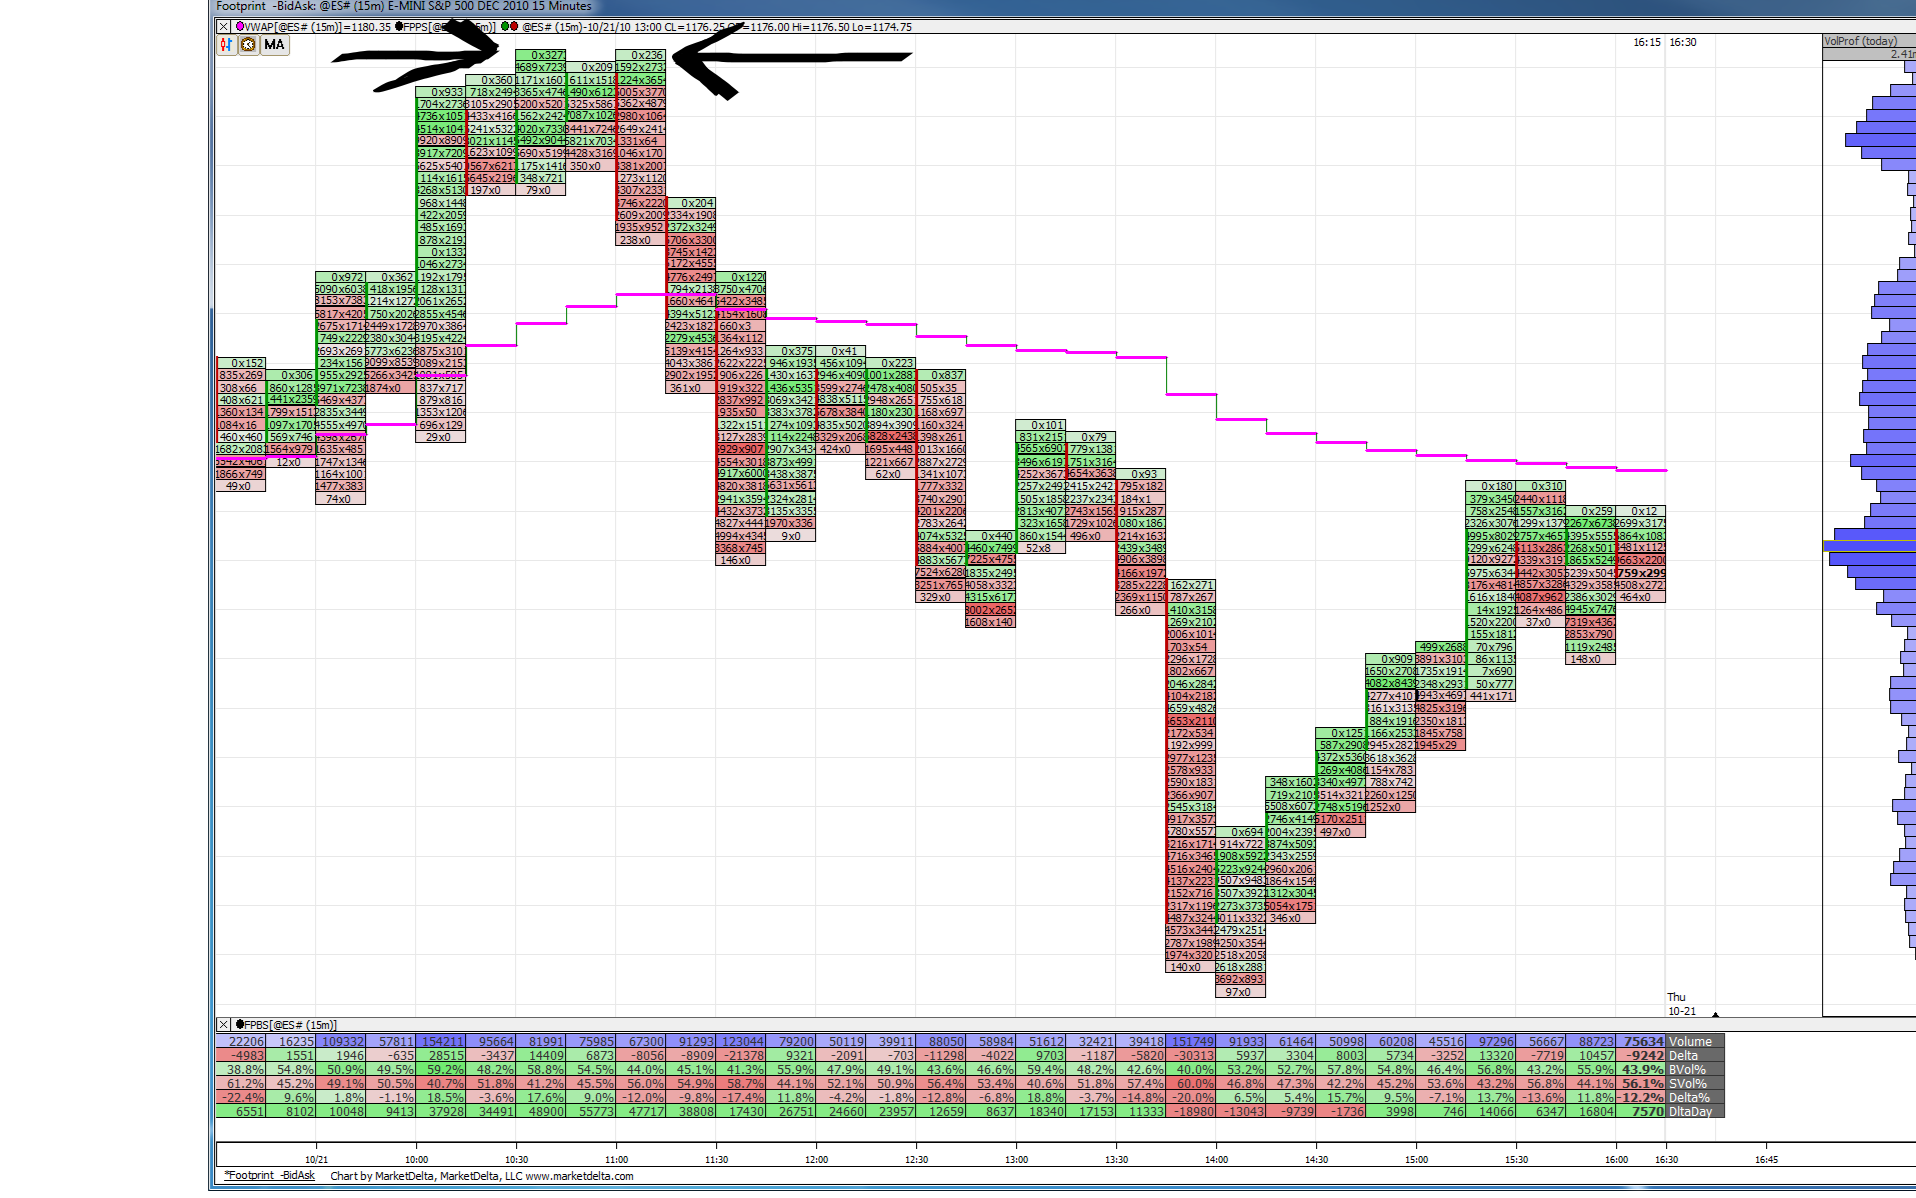
I don't think that really is what your point is geared at though. Sudden high-volume spikes, from my experience, can mean both things, exhaustion of a move or the beginning of a move. I think the context of the volume spikes is much more important then the spikes themselves. As you say, if price hit the O/N lows today and volume starts to spike I personally will be watching the PA as well as the breakdown of delta (bid/ask difference) to determine if the new volume is being absorbed by the market or if price will (as Dalton would say) auction to a new value.
I've attached a chart from yesterday to show the low-volume at YD's highs.
Cheers!
You are spot on in questioning the strength of low volume zones from O/N action. The fact it is the O/N Low brings its importance up in the world. I mainly pointed it out for examples sake because its an easy one to see.
According to Dalton a high-volume zone is one where price slows down and spends time at, which can be used as targets for when a trade is on because price should slow down again within a high-volume zone allowing hassle free exit of a trade.
I don't think that really is what your point is geared at though. Sudden high-volume spikes, from my experience, can mean both things, exhaustion of a move or the beginning of a move. I think the context of the volume spikes is much more important then the spikes themselves. As you say, if price hit the O/N lows today and volume starts to spike I personally will be watching the PA as well as the breakdown of delta (bid/ask difference) to determine if the new volume is being absorbed by the market or if price will (as Dalton would say) auction to a new value.
I've attached a chart from yesterday to show the low-volume at YD's highs.
Cheers!
Click image for original size
thanks, Lorn
Emini Day Trading /
Daily Notes /
Forecast /
Economic Events /
Search /
Terms and Conditions /
Disclaimer /
Books /
Online Books /
Site Map /
Contact /
Privacy Policy /
Links /
About /
Day Trading Forum /
Investment Calculators /
Pivot Point Calculator /
Market Profile Generator /
Fibonacci Calculator /
Mailing List /
Advertise Here /
Articles /
Financial Terms /
Brokers /
Software /
Holidays /
Stock Split Calendar /
Mortgage Calculator /
Donate
Copyright © 2004-2023, MyPivots. All rights reserved.
Copyright © 2004-2023, MyPivots. All rights reserved.