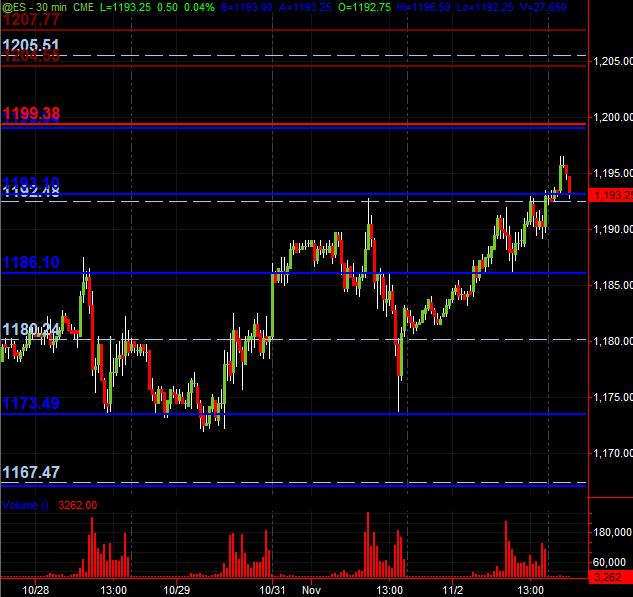
ES S/R Map for 11-3-10
It's closing in on 8pm central time with the elections coming in and a bunch of stuff/reports in the morning ... especially the FOMC gig.
But here's what I've got as potential Support and Resistance price "zones." The Blue lines are derrived from my eyeballing of prior price action across multiple time frames. The Light Blue (whitish) dashed lines are the Wkly Pvts. The Red line is some confluence of fib "exhaustion" projections at the 1199-1200 zone which coincides with potential price action resistance and also showing 1198 as Daily R2 (not to mention the "round number" effect of 1200).
The Maroon lines near the top are simply a ZONE from the RTH high and Overnight high from April 26: 1204.50-1207-75 (continuous contract)with a Wkly Pvt of 1205.50 in that zone.
Below where the ES is currently trading is PASR potential support and Wkly Pvt of 1192-1193 area.
Next stop down as only semi-significant potential support is 1189 while 1186 is more significant, both PASR levels (which, at only 3 points, could be considered a wider "zone."
Just a map for coming into Wednesday's trading. Hope some find this helpful!
Click image for original size
downside magnets if they push down first are the 69 and 64 area for me
85.75 is pre fed number....it will be a magnet back to it..
90.25 is a no-volume area....so if we can get this thing up a bit more then we will have two reasons to take the fade and sell...94 - 96 is key short zone first for the fade short
Fascinating stuff. Still can't get a 15 min close above VWAP although its attempting here again.
Click image for original size
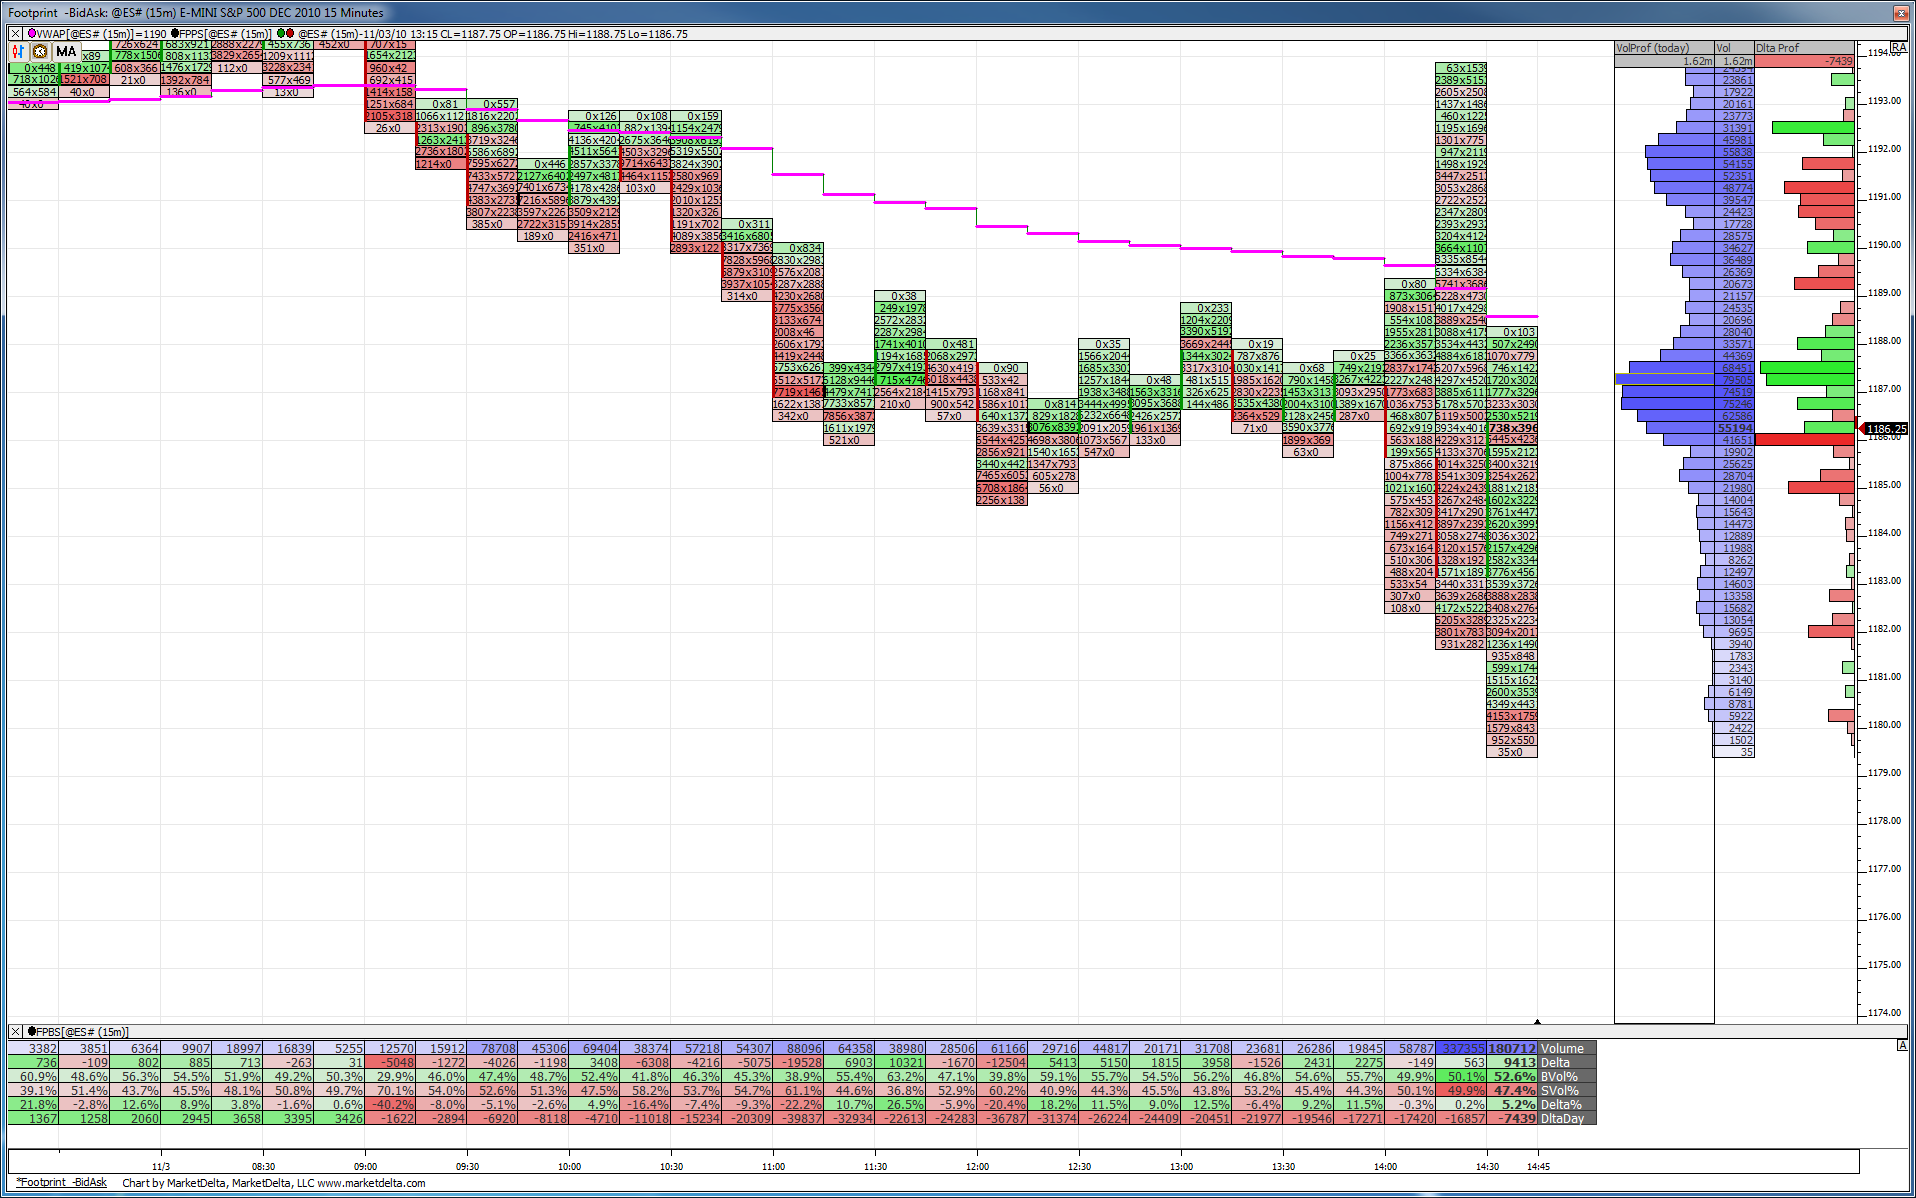
For those who question the power of the overnight session. Here are two profiles: The one of the right is the split profile of todays day session only. The one on the left is the O/N session. Red Lines are the peak volume prices. Look how "I" period in the day session went up for the test and sold off from the peak volume of the O/N session...no magic to why I mentioned the 94 - 96 area in the above post....hopefully the astute observer also will see the lack of volume at the 90.25 area too that I mentioned....no volume on the horizontal histogram from the day session in that area!
Click image for original size
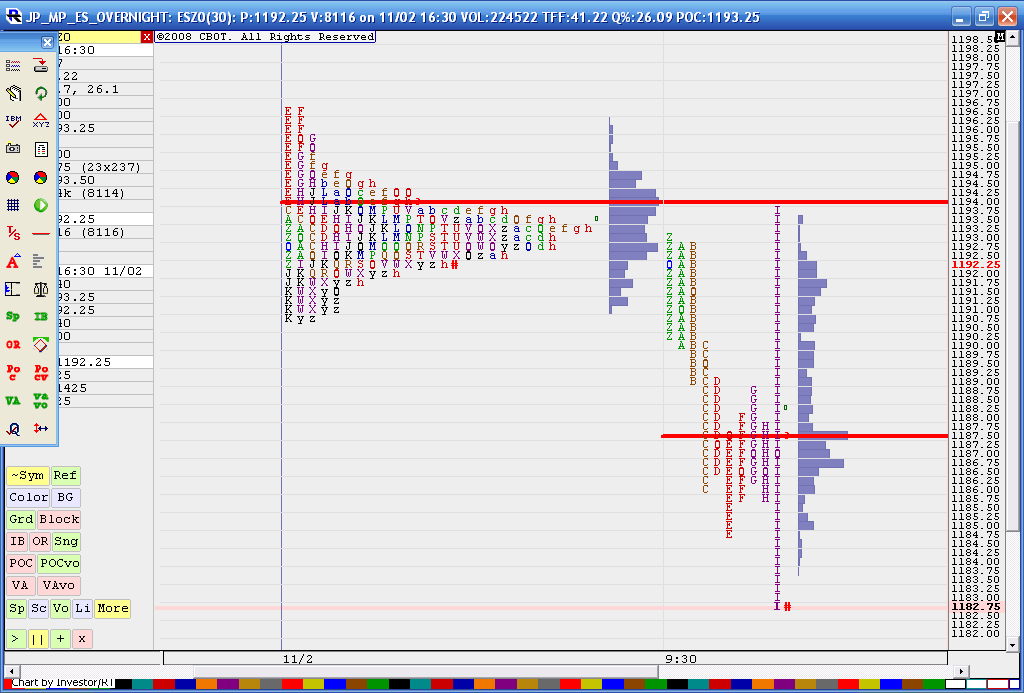
this may be a bit more agressive due to time but we have low volume 89.25 and peak volume down at 87.50...market is at 92.50 but building value.....
Originally posted by BruceM
90.25 is a no-volume area....so if we can get this thing up a bit more then we will have two reasons to take the fade and sell...94 - 96 is key short zone first for the fade short
Nice numbers ... thanks for the analysis behind them and rationale for a trade's entry range and espec. exit target to look for ... good shootin' there Tex!
the high volume node just jumped from 87.50 up to 91.75..... volume is getting attracted at higher prices so that is good for bulls in theory and they tested that low volume in the 89 - 90.50 area...reason I'm sitting out now is I don't like how we traded in equal amounts above and below the 87.50 before it flipped higher ( this was also the average of the range !!!)and we still have low volume in there....so this can still go down to 87.50
"when in doubt, sit it out" - glad that made sense MM...at least I hope it did
"when in doubt, sit it out" - glad that made sense MM...at least I hope it did
Emini Day Trading /
Daily Notes /
Forecast /
Economic Events /
Search /
Terms and Conditions /
Disclaimer /
Books /
Online Books /
Site Map /
Contact /
Privacy Policy /
Links /
About /
Day Trading Forum /
Investment Calculators /
Pivot Point Calculator /
Market Profile Generator /
Fibonacci Calculator /
Mailing List /
Advertise Here /
Articles /
Financial Terms /
Brokers /
Software /
Holidays /
Stock Split Calendar /
Mortgage Calculator /
Donate
Copyright © 2004-2023, MyPivots. All rights reserved.
Copyright © 2004-2023, MyPivots. All rights reserved.