ES key levels on the downside
some levels as we go forward....downside only..wishful thinking perhaps as the world seems on bullish. Ranges are fairly small so zones are tight...not much room from level to level
1213.50 - 15.25 - VPOC and spike initiation point ****** key support for friday,,longs don't want it to open below that on Friday morning!!
1207.50 - 09.50 Thursdays RTH open and low volume
1202 - 1204.75 - VPOC from Thursdays O/N session
1197- 98.75 Gap and VPOC from ON
87 -91 VPOC and low volume - may rotate here a bunch to fill in the profile
84.50 - low volume area begins and HV from composite
78 - 81 ***** major support , the center of the universe....we have been watching this number for a long time
I have a projection to 1226 by 11:30 or so.
The projection will be void if moving below 1215.25 ES no trading 1219:00 @ 10:27
The projection will be void if moving below 1215.25 ES no trading 1219:00 @ 10:27
I got stop out B.E. and the projection was voided.
IN the 60m chart I can count a 5 EW up, but I don't know if it is a 5 of 3, if it is. then we still have one more impulse up. Or currently making an a,b,c,d,e of a #4 then 5# up.
Will see, in due time the market will show me the way
IN the 60m chart I can count a 5 EW up, but I don't know if it is a 5 of 3, if it is. then we still have one more impulse up. Or currently making an a,b,c,d,e of a #4 then 5# up.
Will see, in due time the market will show me the way
Originally posted by i1hunter
I have a projection to 1226 by 11:30 or so.
The projection will be void if moving below 1215.25 ES no trading 1219:00 @ 10:27
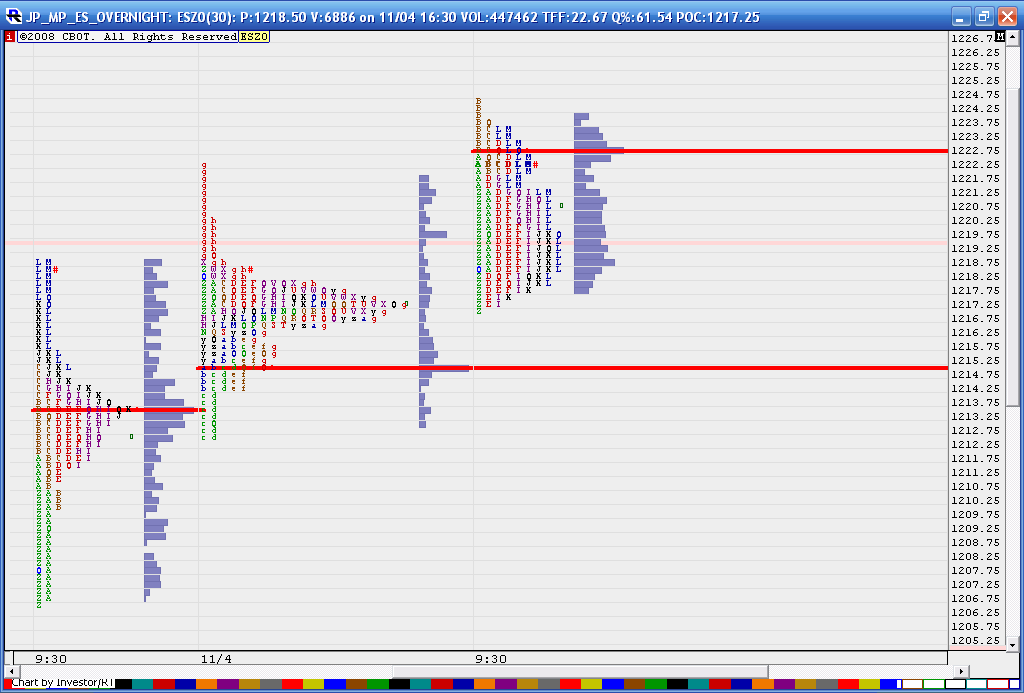
No problem MM ...here are three profiles...you are looking at Thursdays RTH session, then the Overnight (Thursday night thru friday morning) and then Fridays RTH trade.
Look at the center profile , that is the O/N session and you may recal we had an 8:30 EST report hit during that session. So that report creates high volume as that is where the buyers entered and my IRT charts snap the red lines at the high volume nodes. That price is 1215.
You can also look at two key areas from Fridays profile.....the obvious red line at 1222.75 but also look at the low volume area just under that.....We need to be aware of the fair ( HV nodes) and unfair prices....so this area 1221.50 - 1222.75 is resistance....
No magic on my part...it's all on the chart...hope that helps..
Originally posted by MonkeyMeat
Nice AIR "coverage" as a target to the upside from early morning lows ... I had a bid out at 13.75 but price didn't quite get there.
Hey Bruce, you mentioned 15 as a number you were watching (mkt. bounced off 15.25). What drew your eye to that number ... I didn't quite catch what you described in your earlier post (pardon my mental density this morning)?
Click image for original size
Hey MM, here is Fridays RTH and the current developing profile from today. I marked off the LOW VOLUME area from fridays trade just for clarity.....Not sure if most can see that from my previous post...nice test in todays "K" period so far...I'm not in on the trade and just pointing out the concept
so these neutral days ( trading that takes place on both sides of the IB)like to test the middle....we need to be careful if it comes back to current highs as it could go through the LV zone for the gap fill...the day is still young
so these neutral days ( trading that takes place on both sides of the IB)like to test the middle....we need to be careful if it comes back to current highs as it could go through the LV zone for the gap fill...the day is still young
Click image for original size

1218 is the middle...investor R/T puts a little box at the midrange of the day....you can see it to the left of the volume bars near todays "I" period low at 1218
so lots of numbers now at 1218...Fridays open, todays open and now the midrange.........u know the expression..."don't diddle in the middle"
gap at 19.75 in the data...this will be the last time I point one out...I promise...LOL
Ah how true, how true!
Originally posted by BruceM
so lots of numbers now at 1218...Fridays open, todays open and now the midrange.........u know the expression..."don't diddle in the middle"
the quick and the dead....here is a shot of the gap...that just filled
Click image for original size
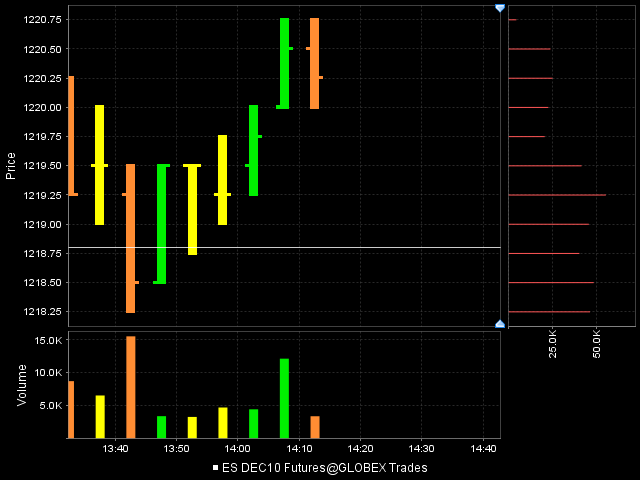
the more time we spend at this 19 area then the more it seems they are accepting higher prices above the midrange of the day...I think they are gonna squueze it up for a gap fill..
that low volume area can't stop it forever...
that low volume area can't stop it forever...
Emini Day Trading /
Daily Notes /
Forecast /
Economic Events /
Search /
Terms and Conditions /
Disclaimer /
Books /
Online Books /
Site Map /
Contact /
Privacy Policy /
Links /
About /
Day Trading Forum /
Investment Calculators /
Pivot Point Calculator /
Market Profile Generator /
Fibonacci Calculator /
Mailing List /
Advertise Here /
Articles /
Financial Terms /
Brokers /
Software /
Holidays /
Stock Split Calendar /
Mortgage Calculator /
Donate
Copyright © 2004-2023, MyPivots. All rights reserved.
Copyright © 2004-2023, MyPivots. All rights reserved.