ES PASR Map for 11-10-10
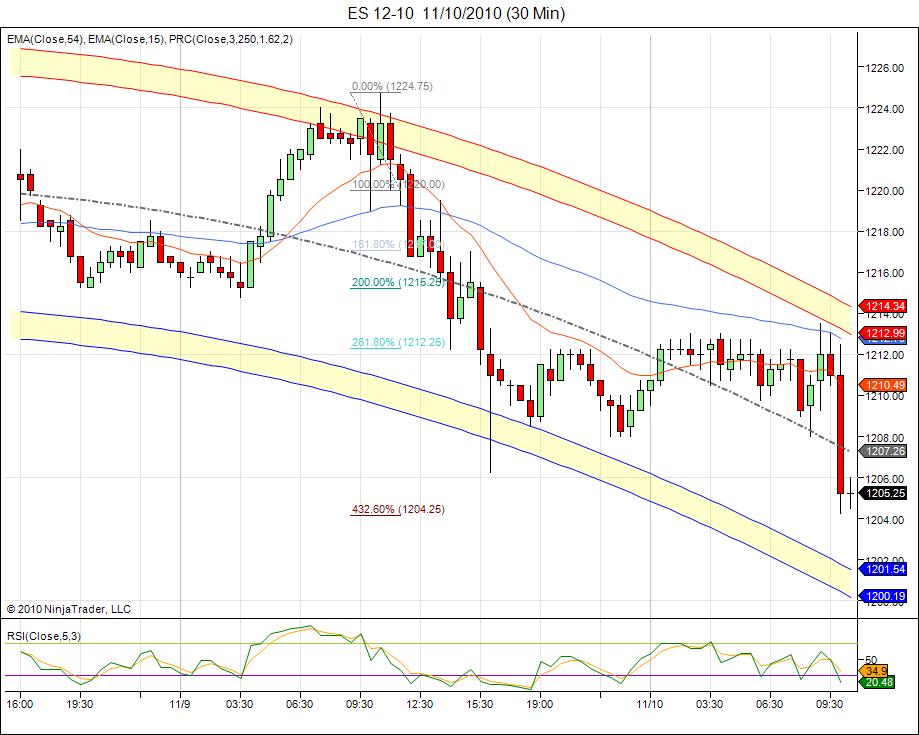
Here's what I've got on the 30-minute chart. Blue lines are PASR levels and are the core of what I'm looking at. Magenta is semi-significant. The whitish dashed lines are Wkly Pvts with a Fib retracement drawn in showing a .386 and a .618 with solid White lines.
Obviously, the clustering of these in a tight area of price tends to be more important as potential Support or Resistance. Hope this is helpful as a MAP for Wednesday's trading. Will hopefully have a chance to post some price levels that are looking significant to me.
Notice how the ES bounced off of the confluence zone at 1206.65 late yday which was a very significant confluence zone fwiw. That was, to me, the most important area I had on the chart even though I didn't think it'd get there. So, here's for tomorrow ... drew some new lines in after the close and so far 1212.50 has held as resistance in early overnight trading. Here's all the pretty lines and colors:
Click image for original size

Here is a 5-min chart I use. That green upward sloping moving average you see is a 600 period MA. Prices have been finding support on this pesky little thing for the last two months. As MM pointed out that 1206 zone is some serious business.
Click image for original size

Here is the footprint of the O/N action. Very interesting behavior imo after yesterday's selloff.
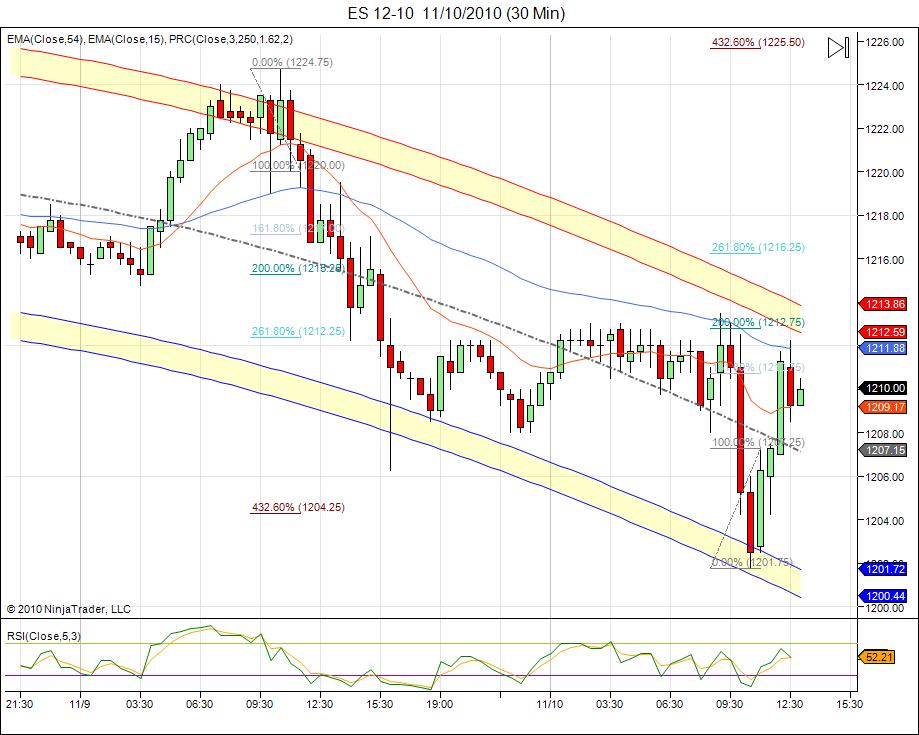
As per Paul yesterday did see the 1.618 level reached to the downside of Monday's range. So the 2.000 level I have at 1202.75. Also the 4.236 projection down off the initial move is 1204.25.
As per Paul yesterday did see the 1.618 level reached to the downside of Monday's range. So the 2.000 level I have at 1202.75. Also the 4.236 projection down off the initial move is 1204.25.
Click image for original size

I see some possible support at 1208.50 and 1204.50
I am actually leaning towards a narrower range today with a close near yesterday's close. We could of course continue the downtrend started yesterday and fill that gap down at 1197.75, but I would need to see trade accepted below 1204 to look for that to happen today.
I am actually leaning towards a narrower range today with a close near yesterday's close. We could of course continue the downtrend started yesterday and fill that gap down at 1197.75, but I would need to see trade accepted below 1204 to look for that to happen today.
Here is that projection down referred to earlier.
Click image for original size
I'm targeting 1195.50. There is a confluence of fibs and S2 too. Will see, yesterday's low is a good resistance. ES is trying to move back up to test it. Will see in due time..
From the overnight high to this morning low we have 50% ret at 1207.50, yesterday's low was 1206.25. So there's some room there for the market to zig-zag. The 1.618 Ext. from today's range is at 1194.50, just a tab below S2 at 1195.50. Will see if will give it this afternoon. I will stay on the side if the ES moves above the 50% or 1207.50.
ES now trading at 1204.50 @ 11:10
ES now trading at 1204.50 @ 11:10
Originally posted by i1hunter
I'm targeting 1195.50. There is a confluence of fibs and S2 too. Will see, yesterday's low is a good resistance. ES is trying to move back up to test it. Will see in due time..
low volume and midpoint still at 07.50.....looking for another test of that assuming this high holds
Here is the 30-min projection up off the morning low.
Click image for original size
I think it wants to go to the pivot at 1214. If it does I will have to go back to my drawing table to figure what next.....
Beautiful call there Bruce. There was a nice buy at 07.50 and I delt sleep on it
Originally posted by Lorn
Here is the 30-min projection up off the morning low.
Click image for original size
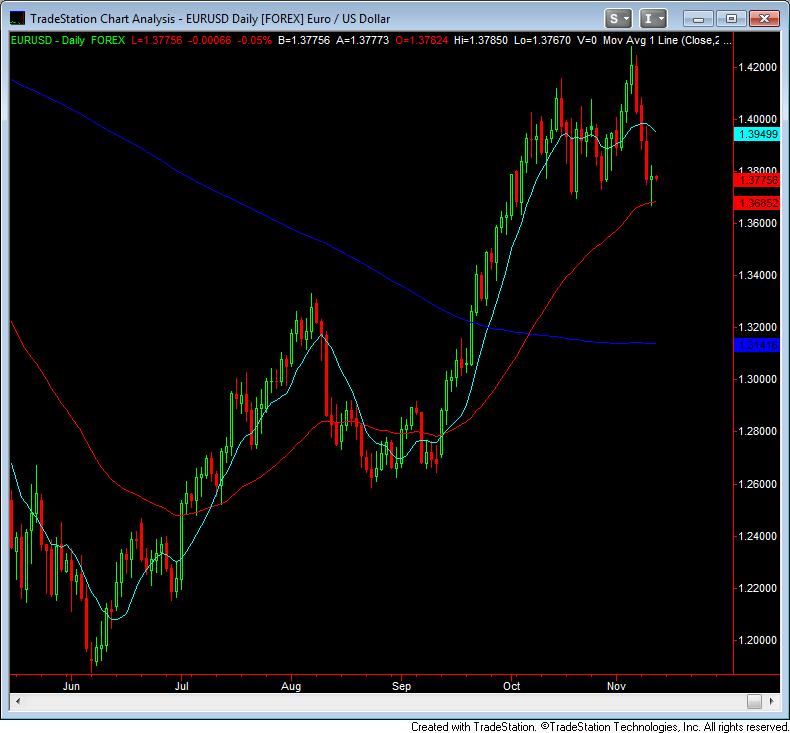
Bounce off the 45 EMA. Critical support over the short term for those who want to be long equities.
Click image for original size
Emini Day Trading /
Daily Notes /
Forecast /
Economic Events /
Search /
Terms and Conditions /
Disclaimer /
Books /
Online Books /
Site Map /
Contact /
Privacy Policy /
Links /
About /
Day Trading Forum /
Investment Calculators /
Pivot Point Calculator /
Market Profile Generator /
Fibonacci Calculator /
Mailing List /
Advertise Here /
Articles /
Financial Terms /
Brokers /
Software /
Holidays /
Stock Split Calendar /
Mortgage Calculator /
Donate
Copyright © 2004-2023, MyPivots. All rights reserved.
Copyright © 2004-2023, MyPivots. All rights reserved.