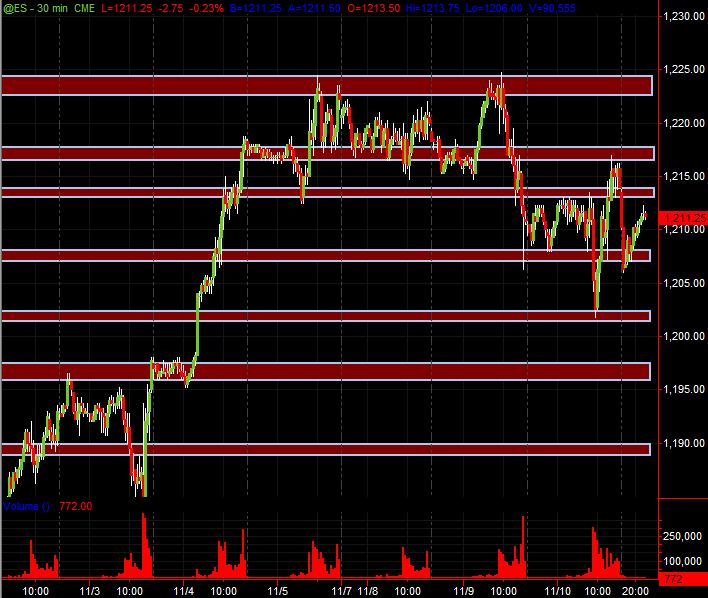
ES S/R Zones Map for 11-11-10
This is what I've got for S/R Zones for Thursday's session. It's derived from PASR/Fib/Daily-Wkly-Pvts and a couple other thangs ... no magic here as its core is the PASR ... all coming from viewing multiple time frames. Hope this is as useful as my prior "maps" that typically had a bunch of lines with all kinds of different and pretty colors ... some solid and some dashed etc.
This is what I'm looking at ... displayed on a 30-minute chart for potential Support/Resistance Zones for Thursday's trading session. Any and all feedback and additional analysis is highly encouraged!
This is what I'm looking at ... displayed on a 30-minute chart for potential Support/Resistance Zones for Thursday's trading session. Any and all feedback and additional analysis is highly encouraged!
Click image for original size
FYI ... here's a "tutorial" link of sorts that shows what I "see" and how I draw in lines based on PASR. Just trying to offer some background as to how I generate my zones.
As I've said, it ain't rocket science ... but a bit of an art though. The point being is that, if this is something that works for you or helps in your trading analysis, then ya can simply do it yourself. Isn't that the point of sharing ideas, strategeries and methodologies to begin with!?!
And obviously, the confluence of Daily and Wkly Pvts plus Fibs etc. are and can be incorporated into the drawing of the S/R zones and which zones are more significant.
http://www.mypivots.com/Board/Topic/5175/1/support-resistance
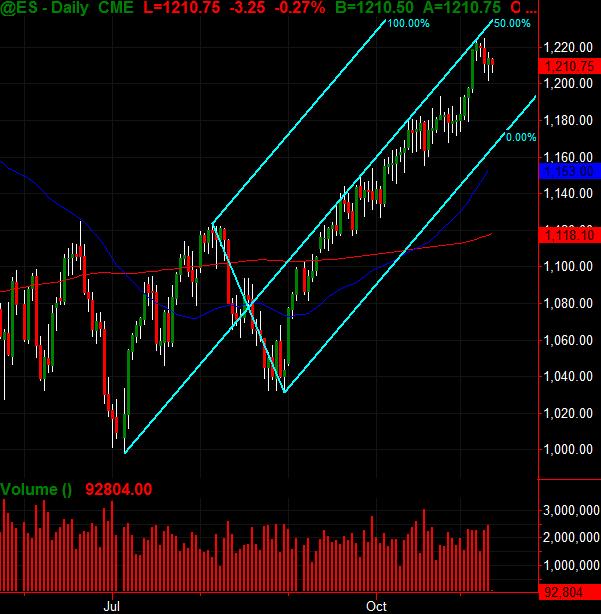
And just to follow up with a bit bigger picture of a couple of Daily charts. The first has an Andrews Pitchfork that I drew in about a month ago ... interesting how price has behaved with the Midline.
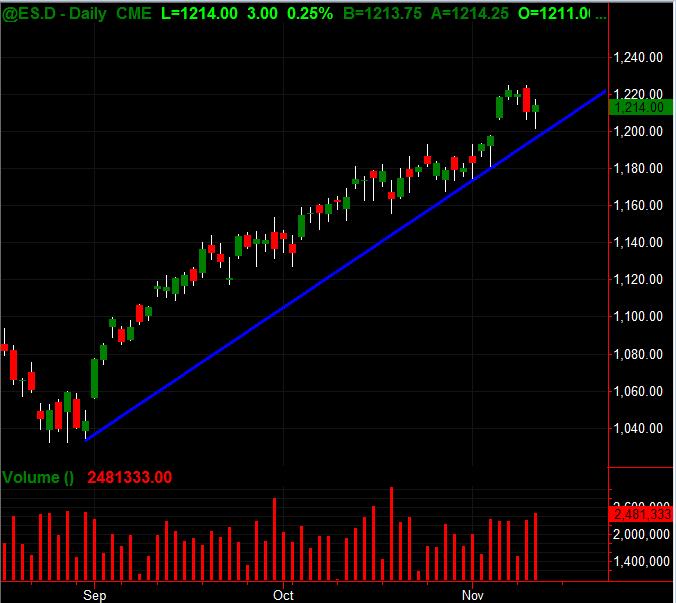
The other is a chart of a simple Trendline that I drew in a while back ... interesting how it's holding ... espec. as of today (Wed.) as it probed down and held/rallied.
The other is a chart of a simple Trendline that I drew in a while back ... interesting how it's holding ... espec. as of today (Wed.) as it probed down and held/rallied.
Click image for original size
Click image for original size
And as a tagline to charting, here's some info that's been posted by Bruce and that I've also followed regarding SENTIMENT and INTERNALS for the market. The link takes you to the main page ... and on the right side, when you scroll down, under the CATEGORIES heading, you'll see links for "Market Internals" and "Sentiment."
http://www.tradersnarrative.com/
Might be a good thing to save under your web browser "favorites"
Rock and Roll and Tons of Money for Traders Tomorrow,
MonkeyMeat
http://www.tradersnarrative.com/
Might be a good thing to save under your web browser "favorites"
Rock and Roll and Tons of Money for Traders Tomorrow,
MonkeyMeat
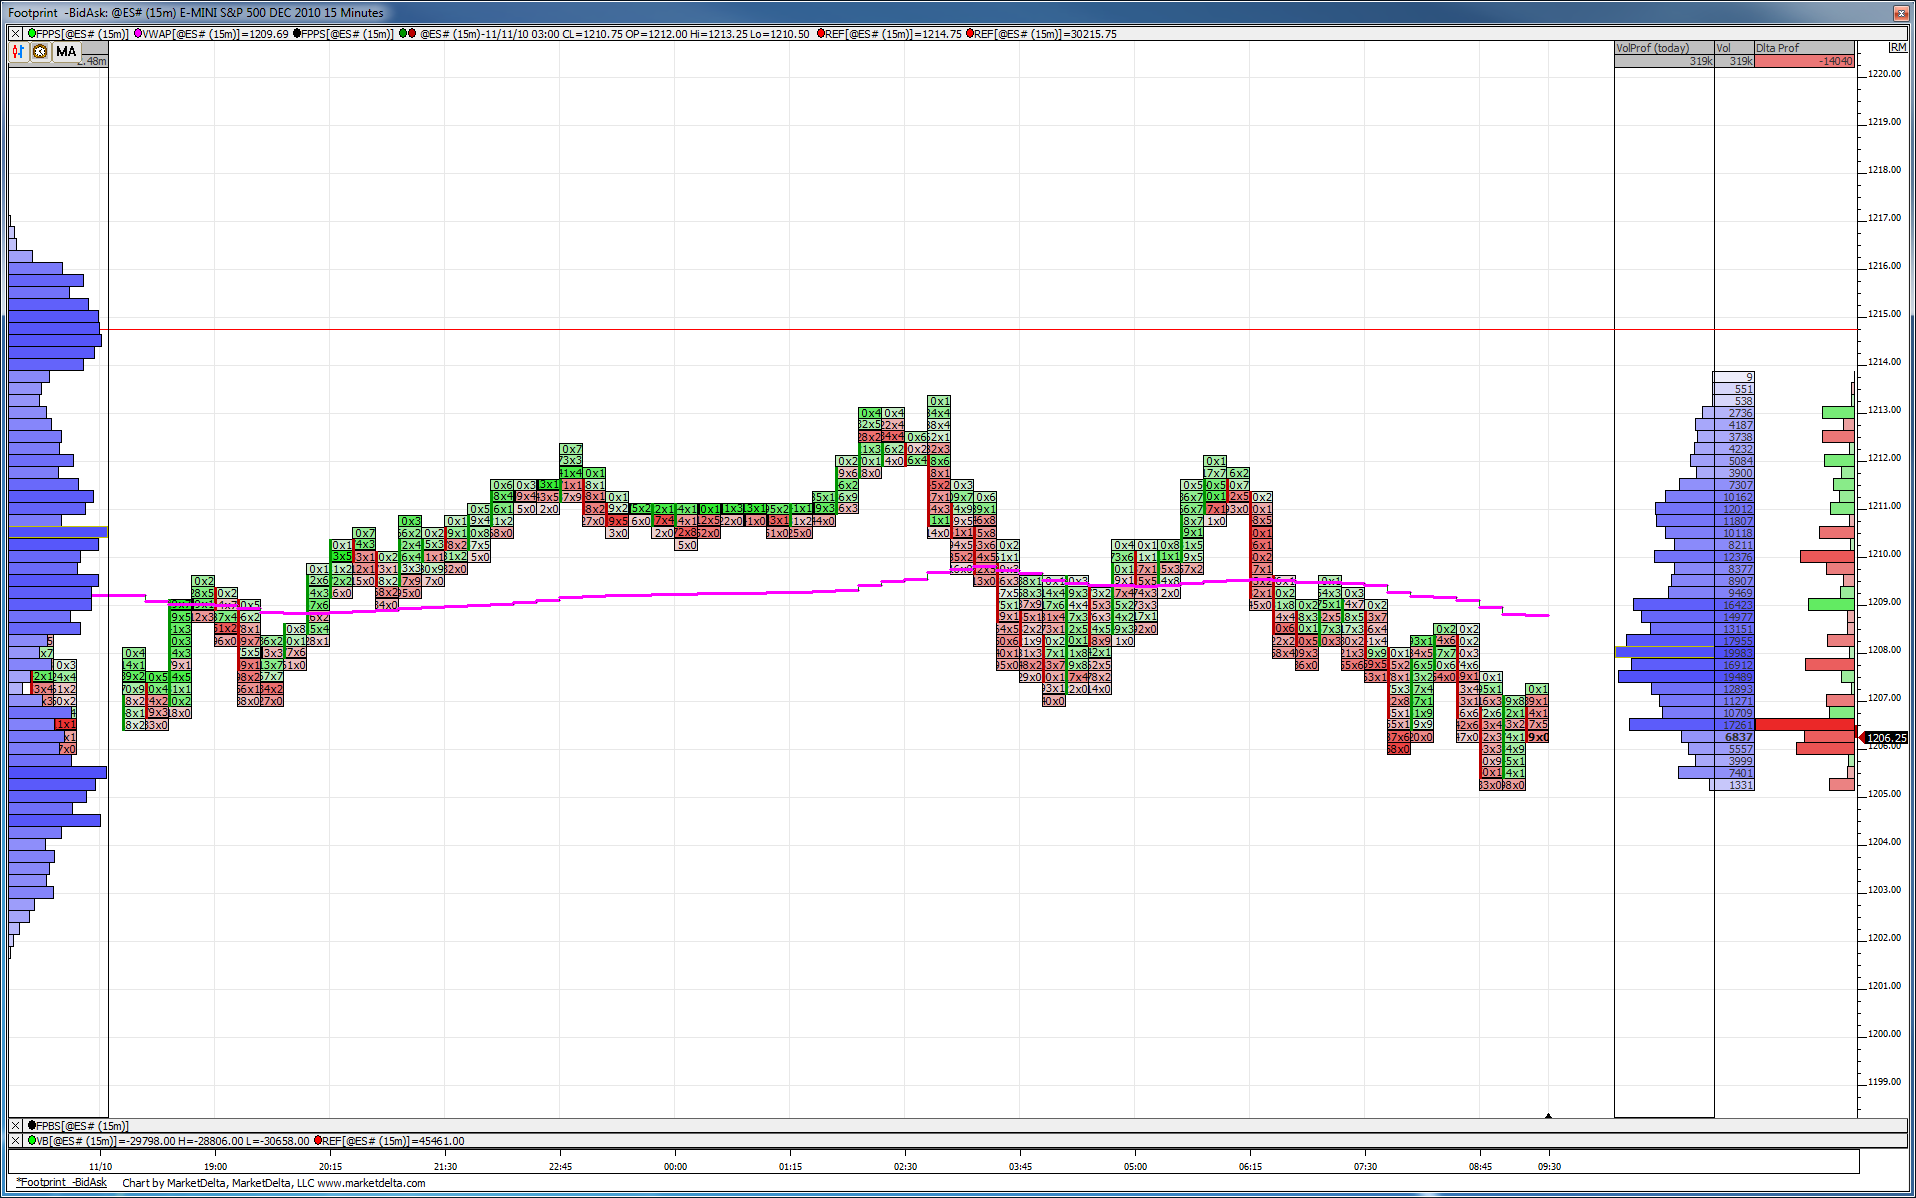
Here is footprint for the O/N. I've also added a volume profile on the left of the chart for yesterday.
Click image for original size
And I'd like the give a thank you to all the veterans out there.
Yesterday's intraday high was 1216.75. Low was 1201.75 = 15.00 rge. 15/2 = 7.50.
1201.75, yesterday's low + 7.50 = 1209.25. So, 1209.25 is 50% of yesterday's rge.
Today's first hourly bar high was 1209.50.
The market open at 1205.75 or 1/4 above yesterday's low. Will you call this symmetry?
Currently ES is trading in the lower 1/2 of yesterday's rge, at 1204.25 @ 11:11 0n 11/11
. ....I have a fibs. back again at 1195.00 or so. - Will see. In due time will show me the way.........
MonkeyMeat how many trade you made in a trading day ?
Originally posted by WickedFox
MonkeyMeat how many trade you made in a trading day ?
Usually 1 too many. Actually, these days I'm trying to keep it around 2 to 3 trades but is really dependent upon what the market is offering "as I see it" for a potentially decent trade. Sometimes I end up not taking any ... other times (here and there) I'll trade a bit much looking for small scalps ... which is usually unprofitable and merely paid entertainment ... so I limit that as much as possible. Also, since I trade equities a fair amount, I split my time and attention between the two. I guess that's the best I can answer your question.
Oops, almost forgot ... I will trade up until 11am Central Time then typically stop.
HI,Mr.MonkeyMeat.I am a new trader.Through your article,i learned a lot of trading knowledge.I have a question.Why don't you publish your ES S/R Zones Map every trading day?
Originally posted by wxstone
HI,Mr.MonkeyMeat.I am a new trader.Through your article,i learned a lot of trading knowledge.I have a question.Why don't you publish your ES S/R Zones Map every trading day?
Glad ya got something out of what you perused. I do post ES zones here semi-regularly. Like I've said, it really ain't rocket science ... may take a little time and practice to "see" good PASR levels but it's not too hard to replicate. I just like having my chart with PASR Signif and Semi-Signif levels w/Wkly Pvts and every once in a while some Fibs all in one place - typically a 30min chart (but drawing from multiple time frames). The only issue to me these days is how heavily to weight the RTH session charts vs. the All Trading Hours charts when trying to divine the "right" levels for what my eyes are seeing.
Originally posted by i1hunter
Yesterday's intraday high was 1216.75. Low was 1201.75 = 15.00 rge. 15/2 = 7.50.
1201.75, yesterday's low + 7.50 = 1209.25. So, 1209.25 is 50% of yesterday's rge.
Today's first hourly bar high was 1209.50.
The market open at 1205.75 or 1/4 above yesterday's low. Will you call this symmetry?
Currently ES is trading in the lower 1/2 of yesterday's rge, at 1204.25 @ 11:11 0n 11/11
. ....I have a fibs. back again at 1195.00 or so. - Will see. In due time will show me the way.........
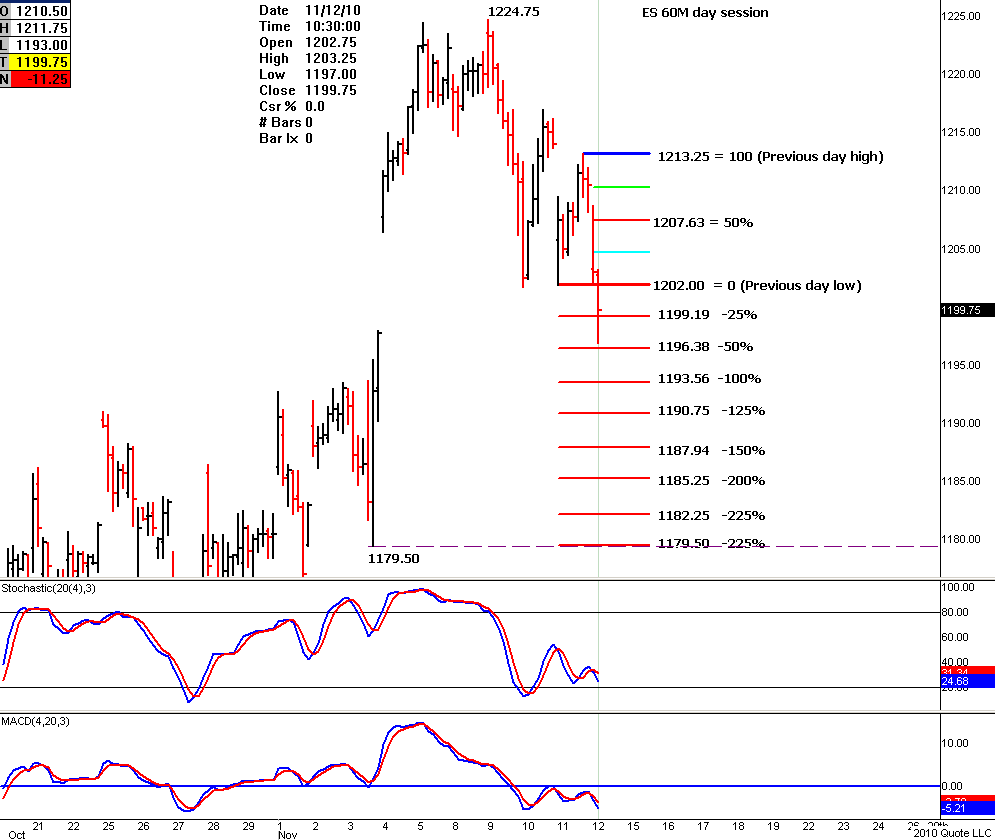
Here is today's 60m chart showing yesterday's RGE and today's subdivisions. What's interesting is that the night session already hit the 1193 area.
I hope that from this chart there's congruency somewhere with your numbers and projections. The more you have a particular number showing up from different outlooks, the more the adds to become a real target.
Click image for original size
Emini Day Trading /
Daily Notes /
Forecast /
Economic Events /
Search /
Terms and Conditions /
Disclaimer /
Books /
Online Books /
Site Map /
Contact /
Privacy Policy /
Links /
About /
Day Trading Forum /
Investment Calculators /
Pivot Point Calculator /
Market Profile Generator /
Fibonacci Calculator /
Mailing List /
Advertise Here /
Articles /
Financial Terms /
Brokers /
Software /
Holidays /
Stock Split Calendar /
Mortgage Calculator /
Donate
Copyright © 2004-2023, MyPivots. All rights reserved.
Copyright © 2004-2023, MyPivots. All rights reserved.