Monkey Needs Help on TS Vol Profile
Trying to get TradeStation to show a Volume Profile (volume at price) ... and created it using the info provided from eminiplayer.com here
http://www.eminiplayer.com/2009/11/how-to-setup-volume-profile-chart-in.html
(There's also a vid walking TS users thru the same thing)
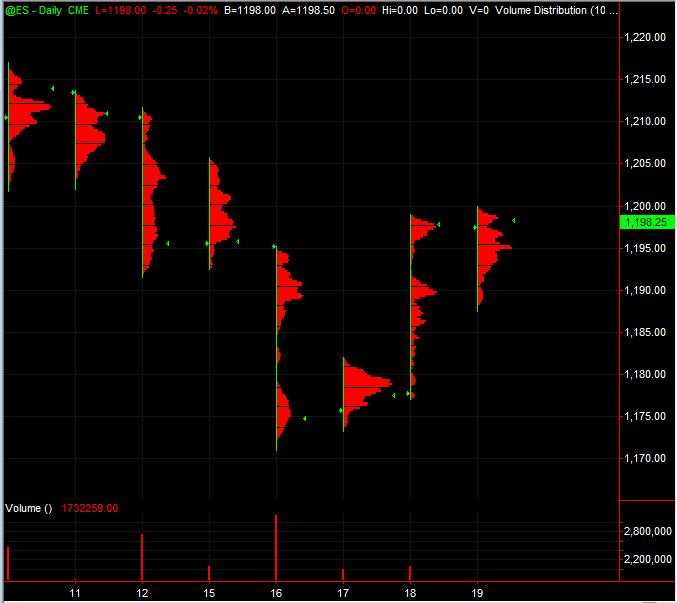
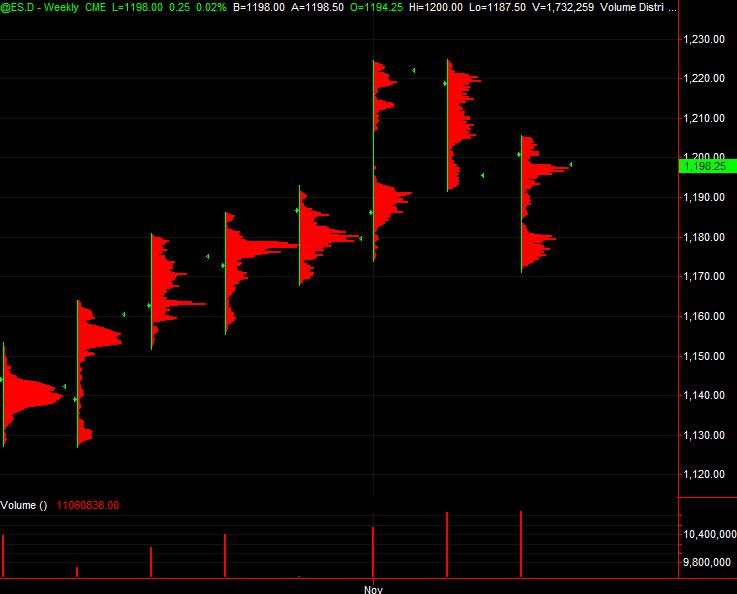
So, I wanted to get feedback from any and all as to how it "matches" up with the Volume Profile your software is currently showing. I'm posting 3 charts. The first is a Daily RTH chart of the ES ... the second is an All Trading Hours (per day) Daily chart of the ES ... and finally a Weekly chart of RTH's.
I'm looking to find if it "matches" your profile(s) ... and especially the High Volume Price(s) and Low Volume Price(s) (nodes)... especially those, and if they are at the same price(s)
Maybe this'll also help anyone else using TS and trying to incorporate a Volume Profile to use for trading analysis.
http://www.eminiplayer.com/2009/11/how-to-setup-volume-profile-chart-in.html
(There's also a vid walking TS users thru the same thing)
So, I wanted to get feedback from any and all as to how it "matches" up with the Volume Profile your software is currently showing. I'm posting 3 charts. The first is a Daily RTH chart of the ES ... the second is an All Trading Hours (per day) Daily chart of the ES ... and finally a Weekly chart of RTH's.
I'm looking to find if it "matches" your profile(s) ... and especially the High Volume Price(s) and Low Volume Price(s) (nodes)... especially those, and if they are at the same price(s)
Maybe this'll also help anyone else using TS and trying to incorporate a Volume Profile to use for trading analysis.

ES Daily chart of All Trading Hours (regular and overnight trading combined):
Click image for original size
Here's a video that eminiplayer.com posted on Youtube ... for how to set up TS with Volume Profile (expanding on what they'd posted as snapshots and written instructions on the site I initially listed above)
Bruce, PT, Lorn, DT and anyone else (everyone else) ... am welcoming and need feedback on this. Much appreciation in advance to all!
Thanks from the Funky Monkey!
Bruce, PT, Lorn, DT and anyone else (everyone else) ... am welcoming and need feedback on this. Much appreciation in advance to all!
Thanks from the Funky Monkey!
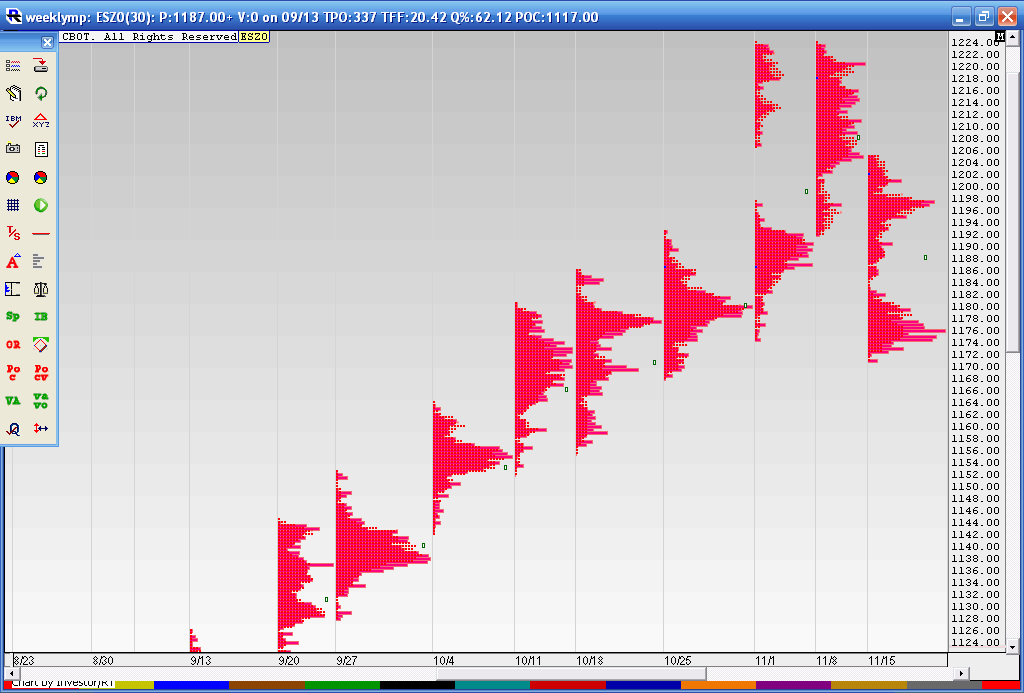
Here is the weekly MM and I think we are very close. Yours may actually be more accurate as IB data ( which I have ) bundles volume...or so I am told....Sometimes scaling of the chart size affects the outcome in IRT.......I think we match up well though.
What jumps out at me is that "Hollow" area between the 1198 area and the 1176 area...I think they will fill that in and very soon...anyway here it is in my world
What jumps out at me is that "Hollow" area between the 1198 area and the 1176 area...I think they will fill that in and very soon...anyway here it is in my world
Click image for original size
It's really kinda hard to determine the accuracy of you volume profiles, the general shape of your RTH daily chart looks about right.
For Friday's RTH volume profile, here are the specific details you should see on your volume profile for various points of interest (peaks and valleys):
price...volume
1197.00 43795
1193.00 66276
1192.25 8650
1189.00 44751
For Thursday's RTH volume profile:
1197.50 128190
1195.75 28024
1195.00 78534
1193.00 7169
1190.75 48309
Your RTH volume profile for each of those days should pretty much line up on exactly those key price levels. The precise volume count at each price will give you a good measure of the accuracy of your profile.
Originally posted by BruceM
What jumps out at me is that "Hollow" area between the 1198 area and the 1176 area...I think they will fill that in and very soon...anyway here it is in my world
Bruce, what does monkey flips and screams in flashing neon red is that ultra-low volume number (3915) at 1183.75, right in the middle of a set of unfilled single prints starting at 1182.75. There is another one (3081) at 1180.50, again in single prints.
If the market somehow breaks back below 1190-1188 zone, then those levels below will quickly come into focus acting as powerful price magnets.
Hey PT and Bruce,
Thanks so very much - seriously! I compared your chart Bruce and compared your numbers PT to what TradeStation shows as I have it configured via the way to generate Volume Profile (shown in above instructions). It was all lining up within a tick or few to what you guys provided. So, ALL GOOD.
Thanks for y'alls feedback. Much appreciations. I'm comfortable working off of the Volume Profile with TS now! Keeps me from having to run another program to track it ... and wasn't totally comfortable with what that program was showing either, though it looks like it's accurate as well ... referring to ThankUrSwam.
MM
Emini Day Trading /
Daily Notes /
Forecast /
Economic Events /
Search /
Terms and Conditions /
Disclaimer /
Books /
Online Books /
Site Map /
Contact /
Privacy Policy /
Links /
About /
Day Trading Forum /
Investment Calculators /
Pivot Point Calculator /
Market Profile Generator /
Fibonacci Calculator /
Mailing List /
Advertise Here /
Articles /
Financial Terms /
Brokers /
Software /
Holidays /
Stock Split Calendar /
Mortgage Calculator /
Donate
Copyright © 2004-2023, MyPivots. All rights reserved.
Copyright © 2004-2023, MyPivots. All rights reserved.