ES Short term trading 11/23/10
O/N hit yesterday's low and currently trading above it 1184.75 @ 08:52. Finding support here, I'll be targeting the Pv at 1193.00, some resistance at 1189.00 and 1191.00.
Failure to find support at yesterday's low (1182.50) will have me looking for 1174.75 and 1169.50 as possible down side objectives. There is some support at 1180.25 R1.
I see for you the same I see for my self: Having the very best of luck and most profitable trading adventure!
Failure to find support at yesterday's low (1182.50) will have me looking for 1174.75 and 1169.50 as possible down side objectives. There is some support at 1180.25 R1.
I see for you the same I see for my self: Having the very best of luck and most profitable trading adventure!
I'm watching 86.50 like a hawk as that had no volume on it yesterday and became resistence in O/N.....also had peak volume near there YD...then it switched higher to 91.25 which is other key..
watching for valid breakdown volume if it comes...otherwise we can stick with mean reversion trading
78 - 81 should be big support..in theroy...LOL!
watching for valid breakdown volume if it comes...otherwise we can stick with mean reversion trading
78 - 81 should be big support..in theroy...LOL!
Still testing or zig-zagging at yesterday's low.
Today's intraday high was 1185.00 at 135^ and the low so far at 1177.00 is directly opposite
at 315^ in other words we'll be in a trading channel for some time here till it breaks out. Most of the action will probably be in the afternoon.
Will see, in due time the market will show us the way.
Today's intraday high was 1185.00 at 135^ and the low so far at 1177.00 is directly opposite
at 315^ in other words we'll be in a trading channel for some time here till it breaks out. Most of the action will probably be in the afternoon.
Will see, in due time the market will show us the way.
Filled the 1175.00 VPOC and 1180.25 single prints from last Tuesday we talked about over the weekend
Providing that the 1182.50 resistance holds (Yesterday's low) the 1169.50 is next objective. Strong support there because we also have 1171,00 support. Keep in mind today's low so far is at 1174.75, therefor some bouncing there or small zig-zags while testing it.
ES now trading at 1180.00 @ 13:46
ES now trading at 1180.00 @ 13:46
see the triangle in the 10m chart? ES is right at the apex line 2 1178.25 - Objectives are:
To the outside at 1186.76
To the down side 1169.50
Symmetry? same #s we talked about this morning...... will see what side breaks out.
The apex for time is at 1:50 tomorrow. Could it do it today? possibly..... will see..
To the outside at 1186.76
To the down side 1169.50
Symmetry? same #s we talked about this morning...... will see what side breaks out.
The apex for time is at 1:50 tomorrow. Could it do it today? possibly..... will see..
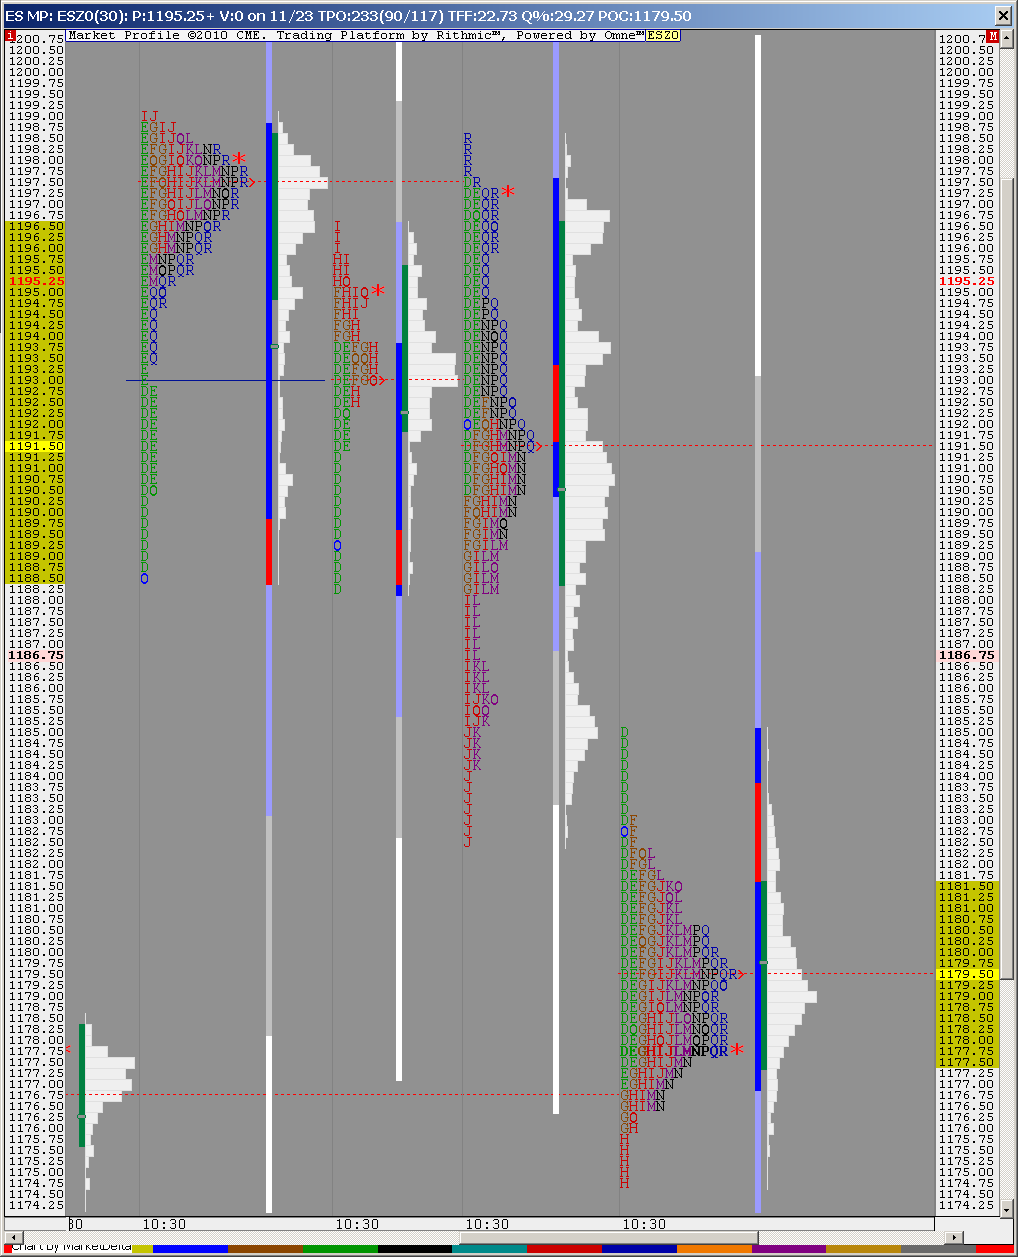
Normal Distribution Day Type:
EDIT: Fixed profile for DST, per Bruce's comment below.
Click image for original size
EDIT: Fixed profile for DST, per Bruce's comment below.
Hey PT,
How come your "D" period high is hitting into 1186.50...my RTH data only has 1185 for a high....but I like how that looks...right into that low volume zone....just not sure if you started the profile early or if it is a scaling issue....
How come your "D" period high is hitting into 1186.50...my RTH data only has 1185 for a high....but I like how that looks...right into that low volume zone....just not sure if you started the profile early or if it is a scaling issue....
Thanks for catching that Bruce !
I dug into the issue and it appears to be applying DST to my normal RTH hour setting, so I applied the correct time zone to the chart and it appears to be correct now.
I uploaded the fixed chart into the above posting.
I dug into the issue and it appears to be applying DST to my normal RTH hour setting, so I applied the correct time zone to the chart and it appears to be correct now.
I uploaded the fixed chart into the above posting.
Emini Day Trading /
Daily Notes /
Forecast /
Economic Events /
Search /
Terms and Conditions /
Disclaimer /
Books /
Online Books /
Site Map /
Contact /
Privacy Policy /
Links /
About /
Day Trading Forum /
Investment Calculators /
Pivot Point Calculator /
Market Profile Generator /
Fibonacci Calculator /
Mailing List /
Advertise Here /
Articles /
Financial Terms /
Brokers /
Software /
Holidays /
Stock Split Calendar /
Mortgage Calculator /
Donate
Copyright © 2004-2023, MyPivots. All rights reserved.
Copyright © 2004-2023, MyPivots. All rights reserved.