ES Short Term Trading 12-02-2010
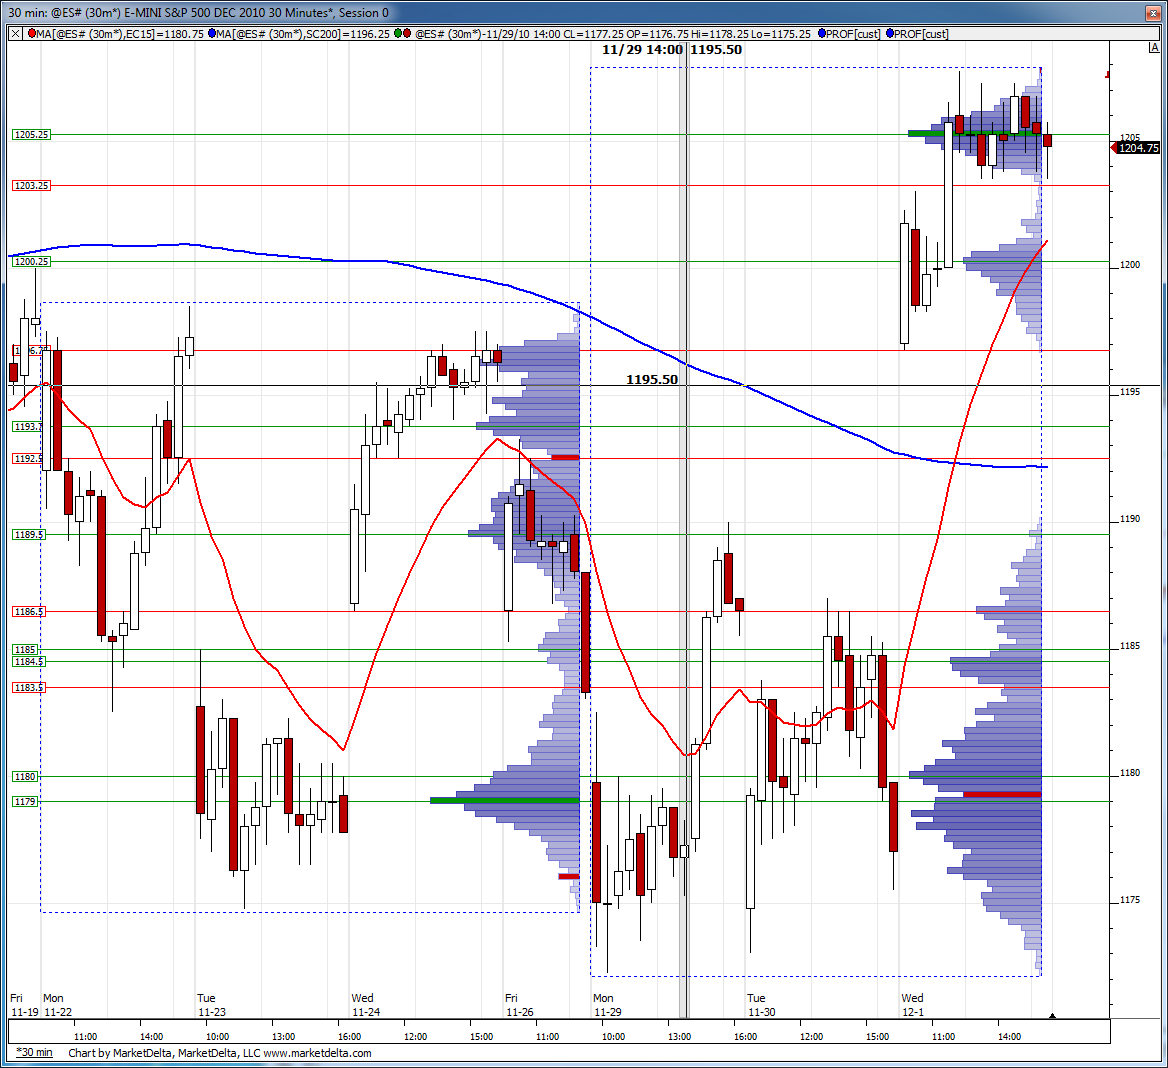
Lets start with some context. Profiles of this week and last week next to each other. We have 1205.25 and 1200.25 as HVN. We have 1203.25 and 1196.75 as LVN. And of course that large gap up yesterday will come into play eventually.
Click image for original size
Thanks for posting this Lorn. I am learning to set up my own charts based on what you and other post in these forums.
here is from the other thread I started...I like the look of yours better. so I'll post here......DT please delete the other one
selling up here in 1209 - 1211 area.....yesterday was 12 to 1 up so that is overbought in my world.....should see gap fill easily today back into 04 - 03 area as first support
Very Interesting chart from stockcharts.com. You can see yesterday's rally came on a weaker A/D then last weeks big rally. So many useful resources available on the web like this forum.
Click image for original size

that was quick and dirty the way we like it......Obviously the key is that breakout point from the longer term view...at 1202 - 1204 ( depending on how ya view it) ...Yesterday we had only an 11 point range in RTh..not very impressive considering almost two thirds of the gap range came in the O/N session.....
so I'm a seller at anything two points above the close of Yesterday....knowing they want to test that breakout point and the quads from yesterday....etc....lots down there to act as a magnet...I think buyers are used up a bit...so anything above 07.25 is sell area..NOW!!!!!!!.and will add above 09 if needed....gap fill in rth I believe
may the force be with you..!
and speaking of the force....
The force of the wind here yesterday in VT was incredible...I just pulled that stop in that afternoon fade and the power failed...then I watched the wind pick up my kids trampoline...a 14ft thing with enclosure etc and toss it across the yard 300 feet like a frisbie.....power came back at 3 thins morning....
Here is the cumulative delta picture heading into the open. That quick selloff brought CD down and tested the support area recently overcome. You can see prices quickly rallied. Lets see if VWAP is resistance going forward.
Click image for original size

Yikes....scary!
Originally posted by BruceM
The force of the wind here yesterday in VT was incredible...I just pulled that stop in that afternoon fade and the power failed...then I watched the wind pick up my kids trampoline...a 14ft thing with enclosure etc and toss it across the yard 300 feet like a frisbie.....power came back at 3 thins morning....
I need to update the "C" pattern thread but what I was expecting to face on the downside actually ended up happening on the upside.....amazing how this thing just doesn't trend.....so I'll stick to daytrading.....
They will need to trade it lower though and fill in that low volume and a big gap like that doesn't stay for long unfilled.....we'll see how long that takes
On session is fairly symmetric so our selling rallies idea should work well....
I don't think 10 am report on home sales is a big threat to fades in higher trade.....Friday at 8:30 is top draw now
Those charts rock Lorn ...!!! crystal clear!!
the quads come in down at 1199.75 area...close to the natural number of 1200......
odds don't favor any type of trend day...opening inside YD range...hopeing for a drive up first to add to shorts....and will do so as long as gap doesn't fill first...
Lets break the bank today and be a bit agressive!!
ORB to the upside should test the globex high (1211.75) quickly. Will look for a short entry setup at that level, keeping in mind the 10am reports are still ahead. Ultimately looking for today's POC to develop at Lorn's LVN around the 1203 area.
starting core at 09.50...will add above 11 if needed...targeting 06 first
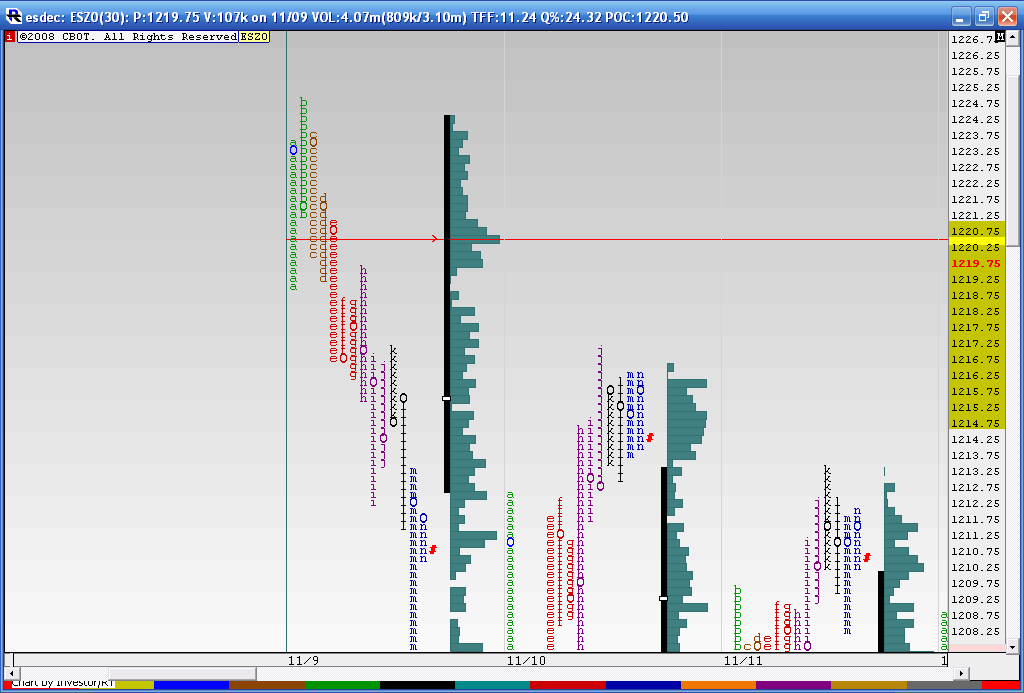
a close up of November 9th and why I had 18.75 , the LVN and the 20.50 , the HVN area I mentioned early this morning...hasn't done much for me yet..
Click image for original size
Emini Day Trading /
Daily Notes /
Forecast /
Economic Events /
Search /
Terms and Conditions /
Disclaimer /
Books /
Online Books /
Site Map /
Contact /
Privacy Policy /
Links /
About /
Day Trading Forum /
Investment Calculators /
Pivot Point Calculator /
Market Profile Generator /
Fibonacci Calculator /
Mailing List /
Advertise Here /
Articles /
Financial Terms /
Brokers /
Software /
Holidays /
Stock Split Calendar /
Mortgage Calculator /
Donate
Copyright © 2004-2023, MyPivots. All rights reserved.
Copyright © 2004-2023, MyPivots. All rights reserved.