Weekend preview es short term trading
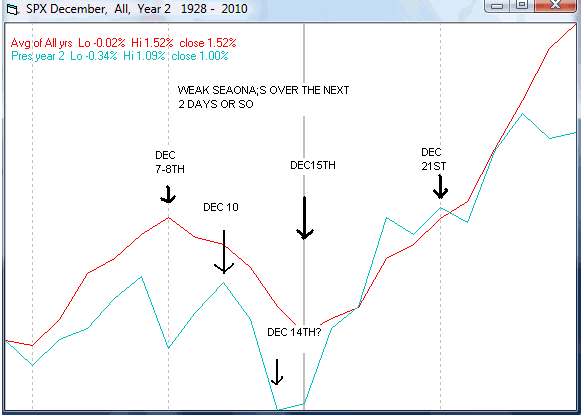
Expiration week. First, lets look at statistics and seasonals: Dec Triple witching week the market has been up 21 out of 26 times since 1984, and 8 of the last 9. Dec is seasonally a strong month. It would appear the bulls have everything going for them, except for very overbought market technicals. The warning signs are there, including a lagging adv/dec line which has not made a new high with prices and fairly large negative divergencies with tech. indicators including the rsi which ,sooner or later, will come home to roost! ...
Click image for original size
.....Click image for original size
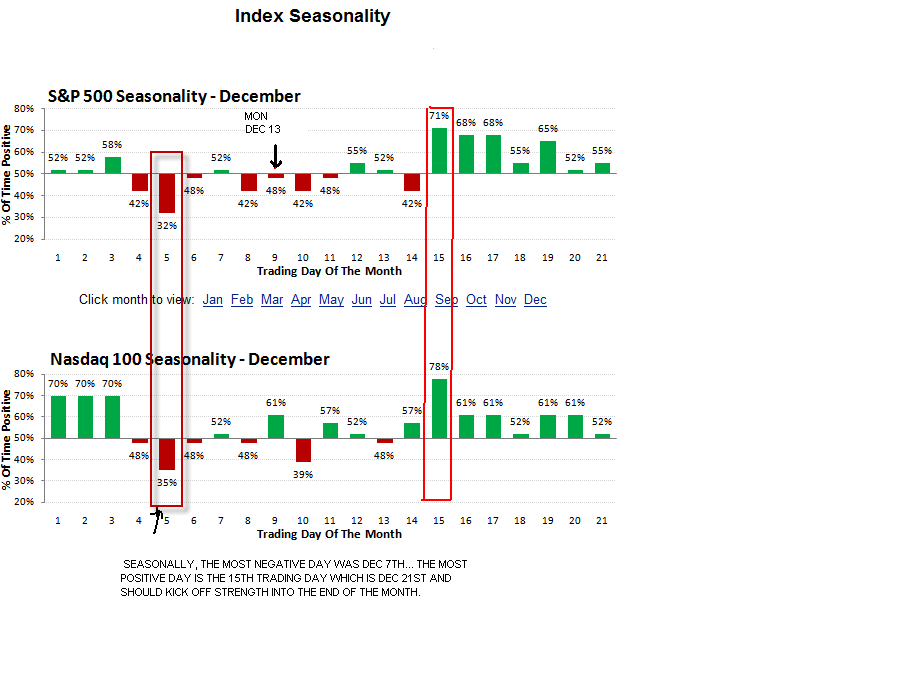
So the seasonal tendencies would be for a day or two of sideways to down before taking off after the 21st for the rest of the month. Note what occurred the last couple of times we had a good neg divergence with RSI on the daily chart...
Click image for original size
Looking at a daily chart, shows a nearly completed pattern....
Click image for original size
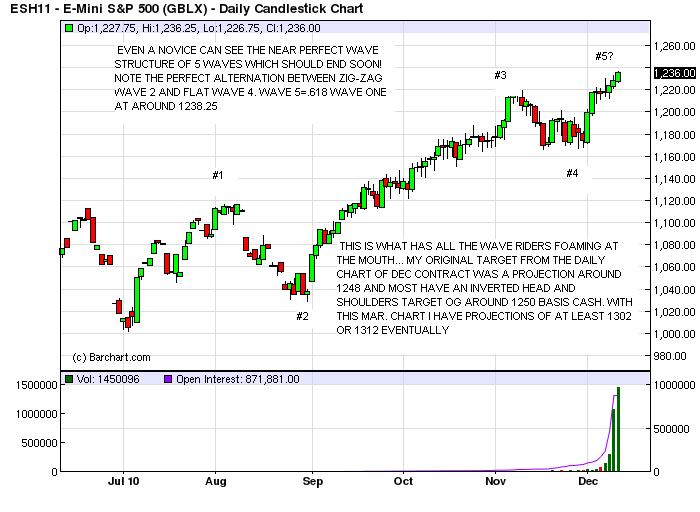
It should be pointed out that a) wave interpetations are notoriusly varied , and b) technicals such as overbought conditions and divergencies can last a very long time before coming to fruition. But i feel that some useful info can still be gleaned from this. first, know that higher, even much higher prices are coming in 2011 (which i have as the last peak year before the decline into the secular bear market bottom 2014-2016).Will we see the 1300's or God forbid the 1400's before all is said and done?... yes and probably. But all technical, and cyclical considerations are pointing to the possibility of an intermediate degree decline (80-120 handles) before then. This could happen now, or stretch into mid Jan at the absoulute latest. kools tools show some decent targets very close now and wave theorists have similar numbers. Areas to watch include 1241 , 1248, 1256, 1302 AND 1312...
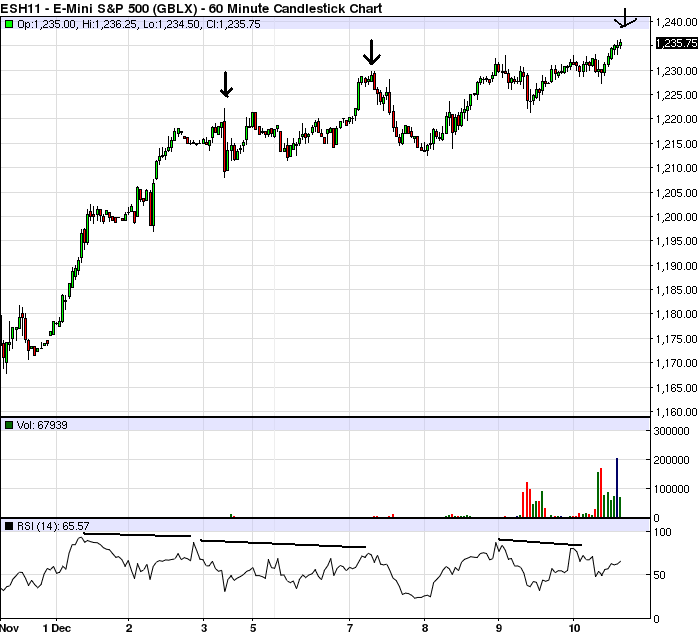
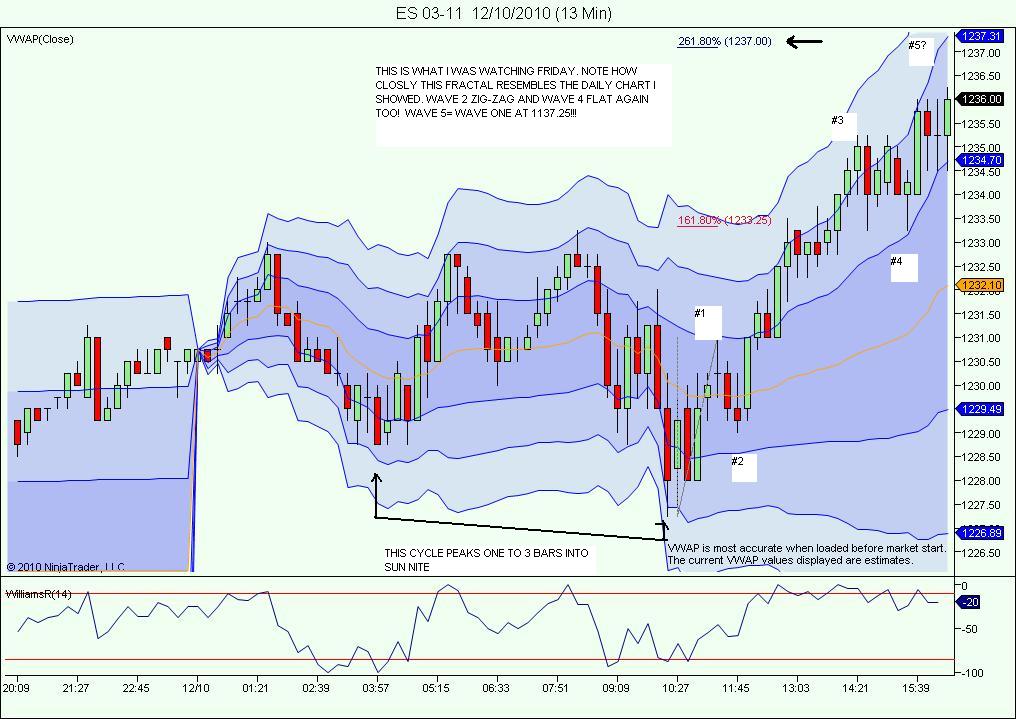
While all the above is interesting, it may be of little use to a short term scalper. I think it does help to have an 'overview' opinion, but the short term can sometimes be a little different. Because of percieved resistance areas here now or just ahead, i'll focus mainly on shorts untill tues or wed next week. First area is 1037 approached friday...
Click image for original size
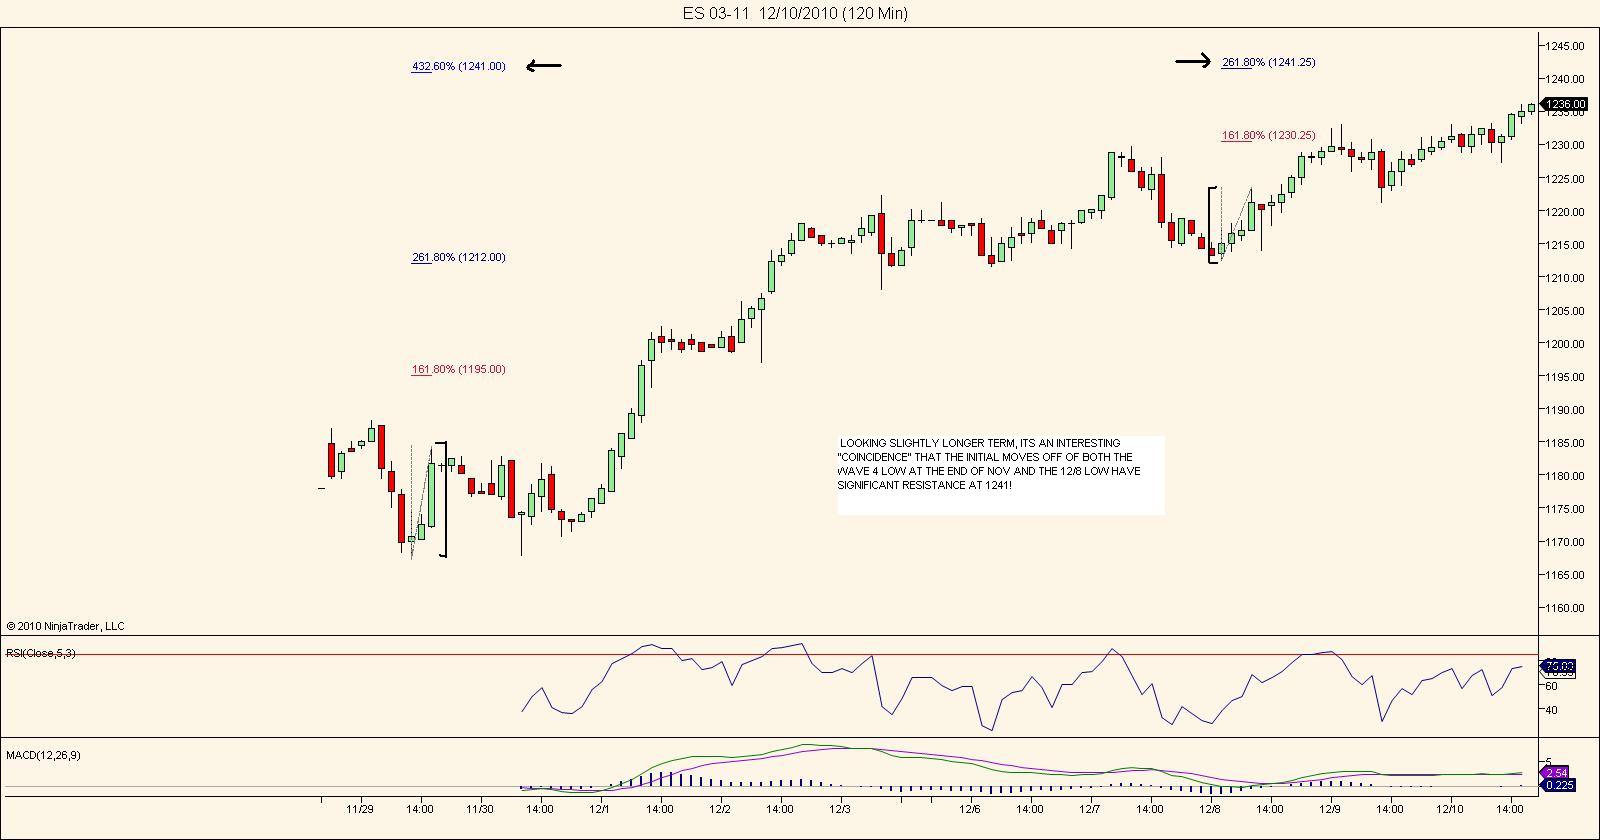
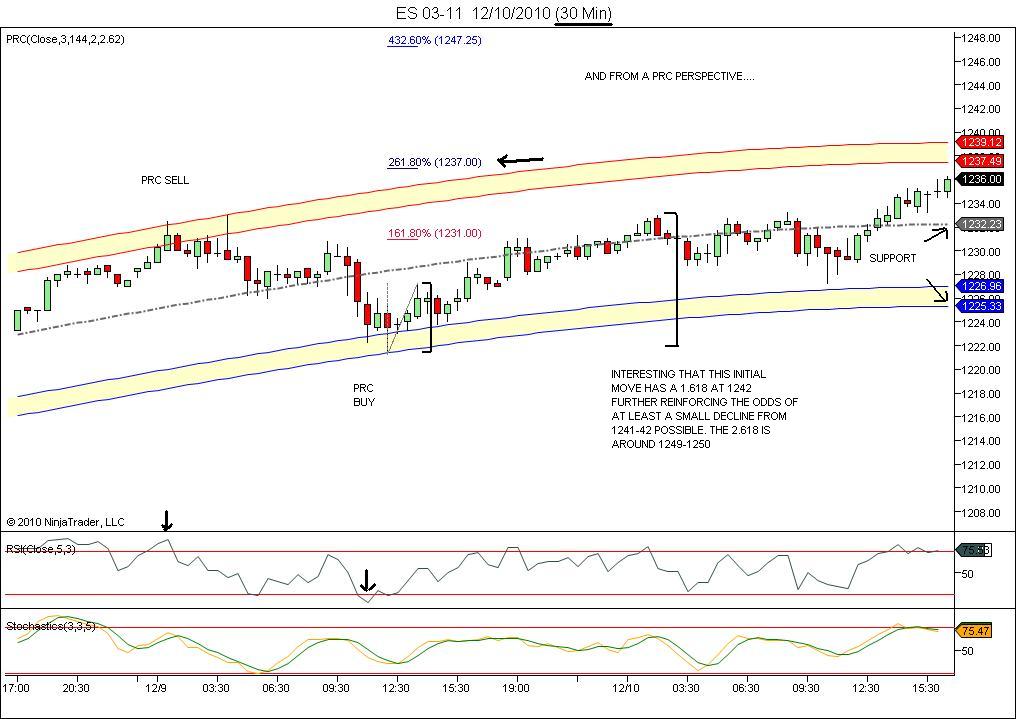
.... and using a slightly longer term chart ,im also going to watch that 1241 area...Click image for original size
remember to click the above charts so you can see them in their entirety
Click image for original size
.... WHO KNOWS? Maybe the market will surprise all of us and blow thru every resistance level ,then decline after stopping out most traders. But as you can see, there are many reasons to be "cautiously bullish" over the next month, expecting a decent decline. Hoping the above analysis and tools are helpful to some in forming there own analysis and strategy.
IN CLOSING, SOME FUN FACTS TO BE AWARE OF:...a) Expiration week is usually positive overall. b) the nas was lagging the s&p and dow at the recent 12/8 and end of Nov lows telegraphing the coming rallies. The nas is still outperforming indicating higher prices coming . c)the same high/lows indicator that had me saying last April that higher prices would eventually be seen (even tho we got a hellova nice decline first! and it took 6 months!) is still saying the same thing. d)anyone notice the last couple years we get a nice decline off of a jan peak into Feb-Mar? And again June to July? e) the avg decline off of a 90 day high when coming off of a higher high and higher low than the last one, is 6.9% and 20 trading days. Shorter term its minimum is 4.4% and 7 days which is exactly what occurred of of the last one at the end of nov! The next one would be expected in jan!(per analyst Jim Curry)
Ps: check out the daily notes page here at Mypivots and look at the R1 levels for Demark pivots (the only ones i ever pay attention to) for the mar es contract...hmmmmm!
Emini Day Trading /
Daily Notes /
Forecast /
Economic Events /
Search /
Terms and Conditions /
Disclaimer /
Books /
Online Books /
Site Map /
Contact /
Privacy Policy /
Links /
About /
Day Trading Forum /
Investment Calculators /
Pivot Point Calculator /
Market Profile Generator /
Fibonacci Calculator /
Mailing List /
Advertise Here /
Articles /
Financial Terms /
Brokers /
Software /
Holidays /
Stock Split Calendar /
Mortgage Calculator /
Donate
Copyright © 2004-2023, MyPivots. All rights reserved.
Copyright © 2004-2023, MyPivots. All rights reserved.