ES short term trading 01/06/11
In order to overcome the 1273.50 resistance barrier from this afternoon, I think the ES will need to open gap up and above it.
So for tonight and tomorrows trading: If ES moves above 1272,50, will target 1276.75 as first objective, above 1276.75, 1281.25 as second obj. above 1281.25, 1285.75 as third Obj.
The voiding point for that possible scenario is at 1269.25.
Below 1269.25, 1265.00 is next support.
ES trading 1272.00 @ 22:22
Will see, and as always, the market has the last word and in due time will show us the way.
I notice that two numbers are missing from my prev. post.
The two are in the down side and appear in the Pvt table. They are: Pivot Point 1267.00 and Mid Point support at 1263.50.
ES trading 1271.00 @ 23:22
J
The two are in the down side and appear in the Pvt table. They are: Pivot Point 1267.00 and Mid Point support at 1263.50.
ES trading 1271.00 @ 23:22
J
Originally posted by i1hunter
In order to overcome the 1273.50 resistance barrier from this afternoon, I think the ES will need to open gap up and above it.
So for tonight and tomorrows trading: If ES moves above 1272,50, will target 1276.75 as first objective, above 1276.75, 1281.25 as second obj. above 1281.25, 1285.75 as third Obj.
The voiding point for that possible scenario is at 1269.25.
Below 1269.25, 1265.00 is next support.
ES trading 1272.00 @ 22:22
Will see, and as always, the market has the last word and in due time will show us the way.
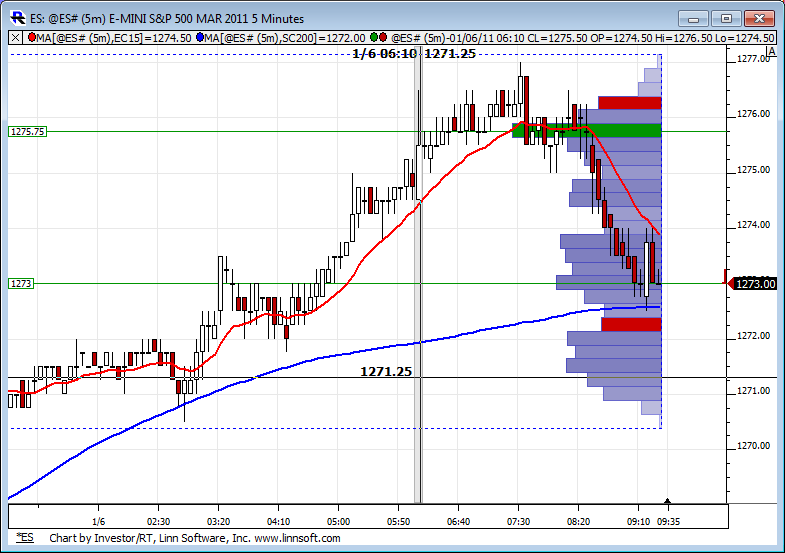
Here is the O/N profile with two HVN's marked since the 8:30 initial claims release. Will have to see if it changes significantly before the RTH open. If so, I'll post an updated chart.
Click image for original size
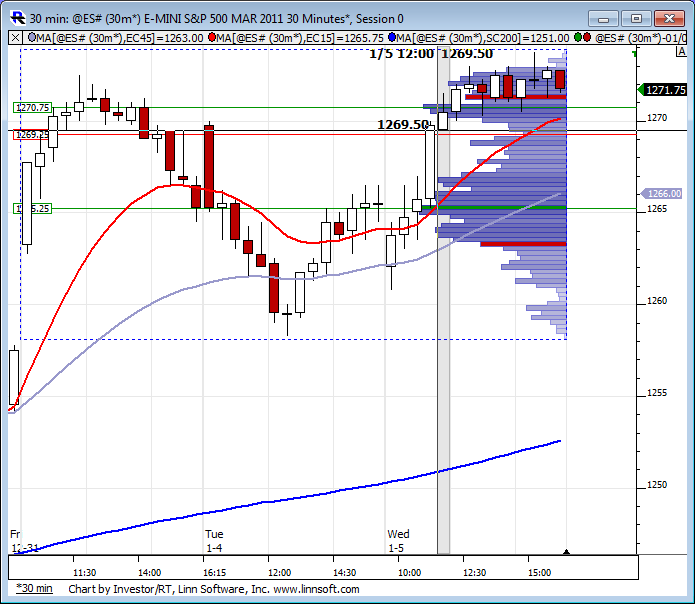
Here is a look at the developing weekly RTH profile. 70.75 and 65.25 showing HVN's (green) and 69.25 showing a LVN (red). O/N action seems to be coming back into this RTH range. Interesting to see if today brings a bit of consolidation. Each day this week has had persistent price movement in either direction, are we in store for more or is it time for sideways action?
Click image for original size
been short since the 75 rat print on the way back down after the 8:30 reports...mean reversion strategies with no 10 am reports to goof us up like yesterday...
Other thing I'm keeping in mind if wrong on later fades is Pauls 1.62 level which is 1278 area and is also an R level and R3 off the weekly......200% will be the 1281 area which is also the next rat at 1281.25...
Will watch to see if yesterday and Tuesdays highs can show support which will obviously have my mean reversion strategies and gap fill ideas challenged..otherwise we should be good to go for gap fill today
Again, watch the euro. If it starts breaking down, equities will most likely follow.
Click image for original size

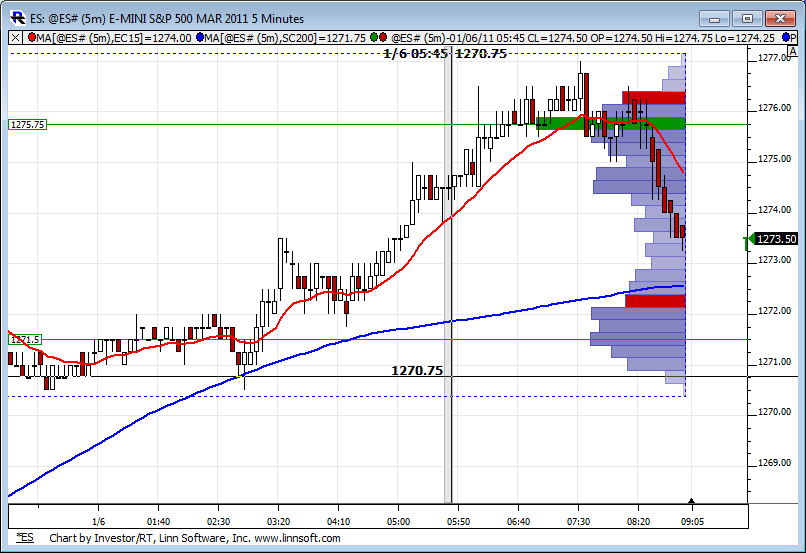
O/N the ES hit 1277.00. The first objective was 1276.75. Then the ES moved down and found support at 1270.75.
Currently the ES is testing yesterday's H. as SR. Moving above 1273.75 will target the overnight high 1277.00 and possibly 1281.00 (second objective.)
The above will be void if ES moves below 1270.75.
ES trading 1273.50 @ 10:31
Currently the ES is testing yesterday's H. as SR. Moving above 1273.75 will target the overnight high 1277.00 and possibly 1281.00 (second objective.)
The above will be void if ES moves below 1270.75.
ES trading 1273.50 @ 10:31
My wimpiness continues... actually went long at 1271.50, looking for the 1.618 at 1274.50, but right before my post i exited at breakeven,, sigh . then i put ina sell at 1274.50 hit exactly ,but no fill!..
Woulda, coulda,shoulda!.. if i had gotten my fill, i would have taken one off here at 1271.50 and let the runner go for you know where!...!@$!@$..kudos Bruce on a nice short
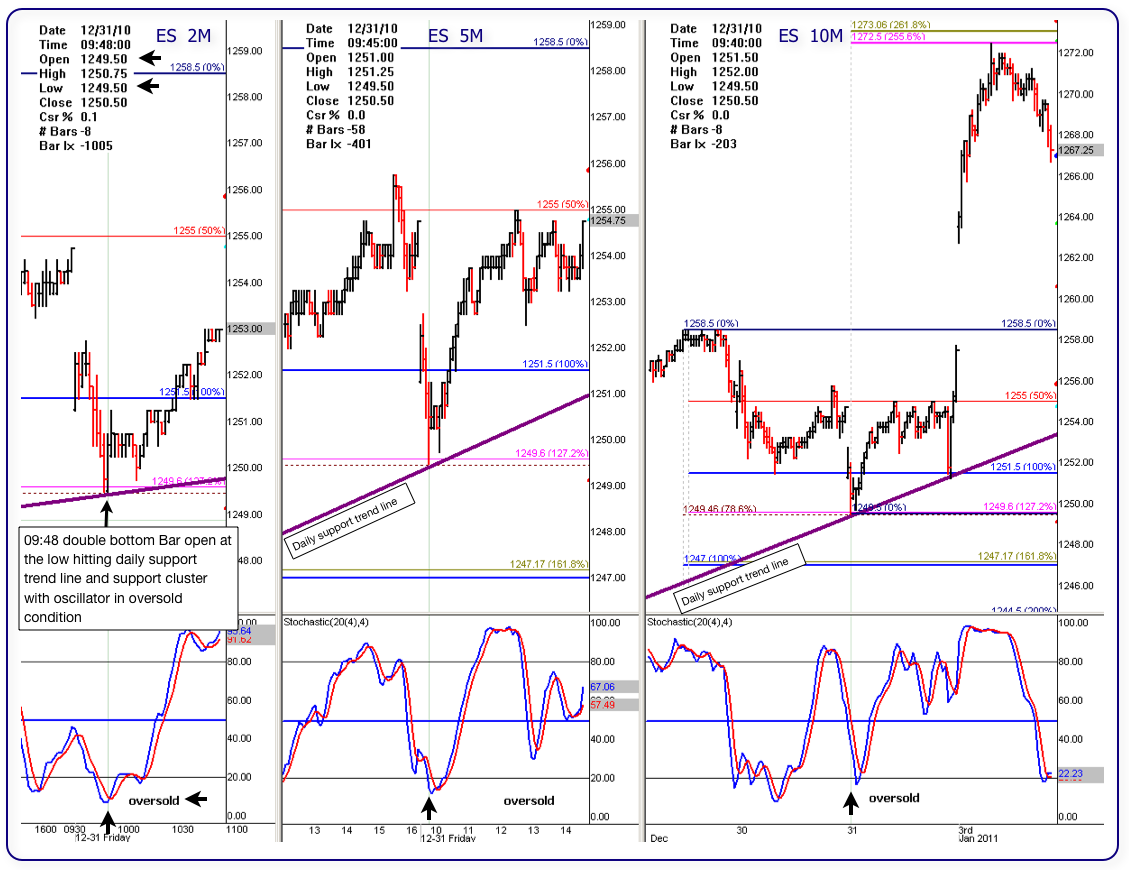
Here is one example of double bottom, "BUT" it is in a 2M chart.
Below is a pic of 3 intraday charts from the same day session 12/31/10. A 2M chart (left), a 5M and a 10M.
In the 2M chart, notice that at 09:46, the price hits the daily support trend line and percentage support cluster (78.6% and 127.2%) then bounces off. The second 2m bar, at 09:48 opens right at support and also bounces off creating a double bottom with the opening right at the low on support.
Notice that the other time frame isolators where working their way down to oversold.
This set-up does not happen often but when it does it is fun to trade it.
Click image for original size
Emini Day Trading /
Daily Notes /
Forecast /
Economic Events /
Search /
Terms and Conditions /
Disclaimer /
Books /
Online Books /
Site Map /
Contact /
Privacy Policy /
Links /
About /
Day Trading Forum /
Investment Calculators /
Pivot Point Calculator /
Market Profile Generator /
Fibonacci Calculator /
Mailing List /
Advertise Here /
Articles /
Financial Terms /
Brokers /
Software /
Holidays /
Stock Split Calendar /
Mortgage Calculator /
Donate
Copyright © 2004-2023, MyPivots. All rights reserved.
Copyright © 2004-2023, MyPivots. All rights reserved.