ES short term trading 01/06/11
In order to overcome the 1273.50 resistance barrier from this afternoon, I think the ES will need to open gap up and above it.
So for tonight and tomorrows trading: If ES moves above 1272,50, will target 1276.75 as first objective, above 1276.75, 1281.25 as second obj. above 1281.25, 1285.75 as third Obj.
The voiding point for that possible scenario is at 1269.25.
Below 1269.25, 1265.00 is next support.
ES trading 1272.00 @ 22:22
Will see, and as always, the market has the last word and in due time will show us the way.
will buy 1266.50 if they let me......see why i wish i had a runner on from that 1271.75 short?
theres your number ,Bruce... great call!
Bought again 1267.25 stop 1266.75
ES trading 1268.50 14:59
ES trading 1268.50 14:59
thanks Kool..u too...will post a 30 minute later with some ideas I'm experimenting with as a guide
Originally posted by koolblue
theres your number ,Bruce... great call!
Looking for a retest of recent high at 1271.75
Will see. in due time it will show me the way.
ES trading 1268.75 15:03
Will see. in due time it will show me the way.
ES trading 1268.75 15:03
Originally posted by i1hunter
Bought again 1267.25 stop 1266.75
ES trading 1268.50 14:59
Moving stop to B.E. and let it go see what will give me.
ES trading 1269.50 @ 15:06
ES trading 1269.50 @ 15:06
Originally posted by i1hunter
Looking for a retest of recent high at 1271.75
Will see. in due time it will show me the way.
ES trading 1268.75 15:03
Originally posted by i1hunter
Bought again 1267.25 stop 1266.75
ES trading 1268.50 14:59
Moving stop up 1 pt to 1268.25
Originally posted by i1hunter
Moving stop to B.E. and let it go see what will give me.
ES trading 1269.50 @ 15:06Originally posted by i1hunter
Looking for a retest of recent high at 1271.75
Will see. in due time it will show me the way.
ES trading 1268.75 15:03
Originally posted by i1hunter
Bought again 1267.25 stop 1266.75
ES trading 1268.50 14:59
Click image for original size
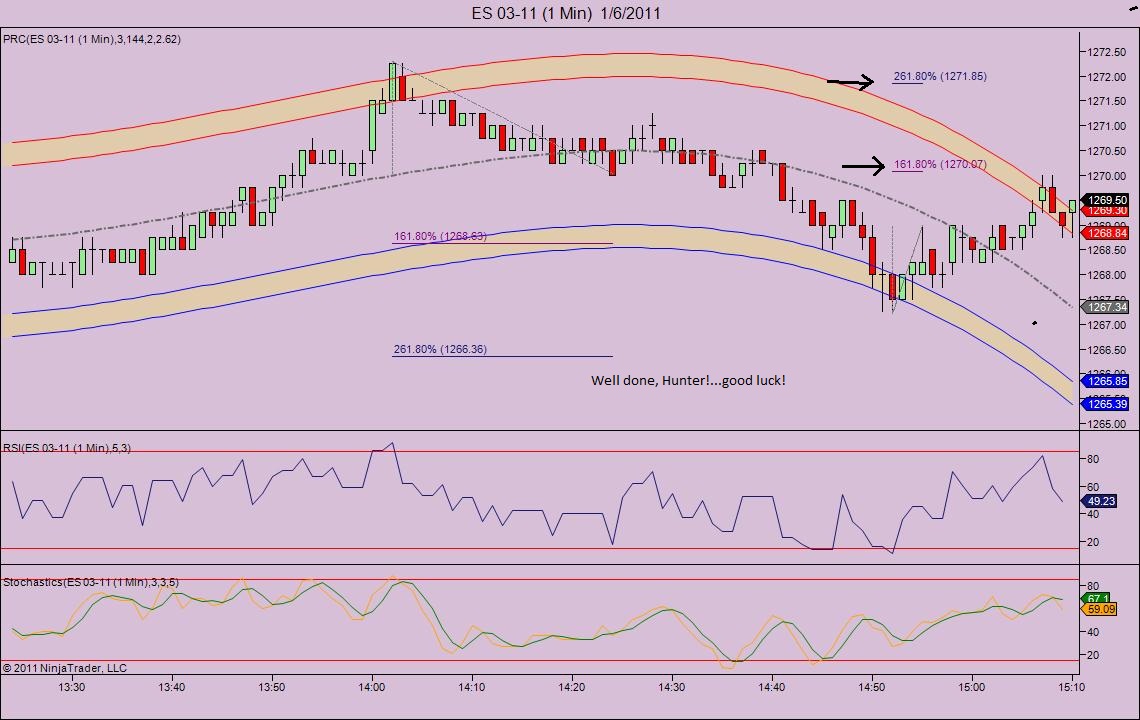
Exit 1269.50
ES trading 1269.25 @ 15:18.
ES trading 1269.25 @ 15:18.
Originally posted by i1hunter
Moving stop up 1 pt to 1268.25Originally posted by i1hunter
Moving stop to B.E. and let it go see what will give me.
ES trading 1269.50 @ 15:06Originally posted by i1hunter
Looking for a retest of recent high at 1271.75
Will see. in due time it will show me the way.
ES trading 1268.75 15:03
Originally posted by i1hunter
Bought again 1267.25 stop 1266.75
ES trading 1268.50 14:59
Very short term oscillators were getting a bit too negative. Any how, great play, posts by every one that participated today.
I see for you the same I see for my self. Having an awesome afternoon
I see for you the same I see for my self. Having an awesome afternoon
Originally posted by i1hunter
Exit 1269.50
ES trading 1269.25 @ 15:18.Originally posted by i1hunter
Moving stop up 1 pt to 1268.25Originally posted by i1hunter
Moving stop to B.E. and let it go see what will give me.
ES trading 1269.50 @ 15:06Originally posted by i1hunter
Looking for a retest of recent high at 1271.75
Will see. in due time it will show me the way.
ES trading 1268.75 15:03
Originally posted by i1hunter
Bought again 1267.25 stop 1266.75
ES trading 1268.50 14:59
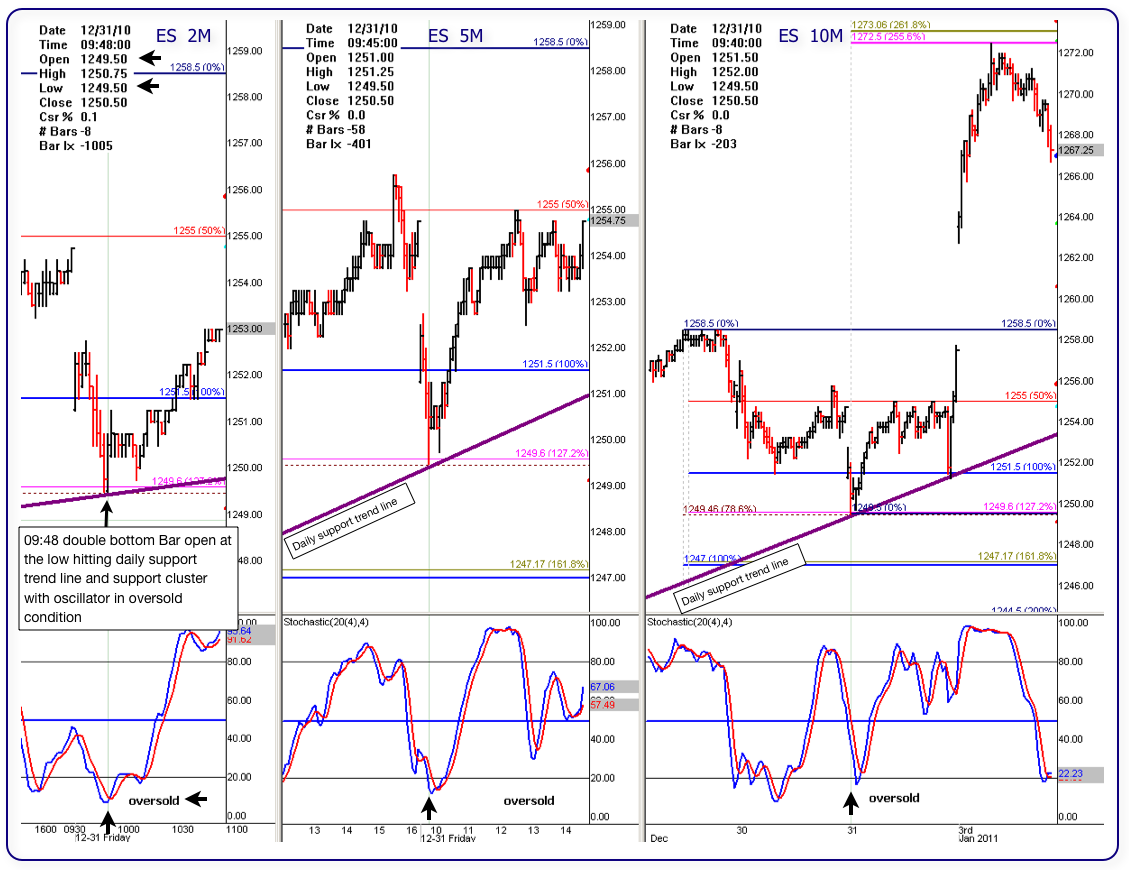
Here is one example of double bottom, "BUT" it is in a 2M chart.
Below is a pic of 3 intraday charts from the same day session 12/31/10. A 2M chart (left), a 5M and a 10M.
In the 2M chart, notice that at 09:46, the price hits the daily support trend line and percentage support cluster (78.6% and 127.2%) then bounces off. The second 2m bar, at 09:48 opens right at support and also bounces off creating a double bottom with the opening right at the low on support.
Notice that the other time frame isolators where working their way down to oversold.
This set-up does not happen often but when it does it is fun to trade it.
Click image for original size
Emini Day Trading /
Daily Notes /
Forecast /
Economic Events /
Search /
Terms and Conditions /
Disclaimer /
Books /
Online Books /
Site Map /
Contact /
Privacy Policy /
Links /
About /
Day Trading Forum /
Investment Calculators /
Pivot Point Calculator /
Market Profile Generator /
Fibonacci Calculator /
Mailing List /
Advertise Here /
Articles /
Financial Terms /
Brokers /
Software /
Holidays /
Stock Split Calendar /
Mortgage Calculator /
Donate
Copyright © 2004-2023, MyPivots. All rights reserved.
Copyright © 2004-2023, MyPivots. All rights reserved.