ES short term trading 1-12-11
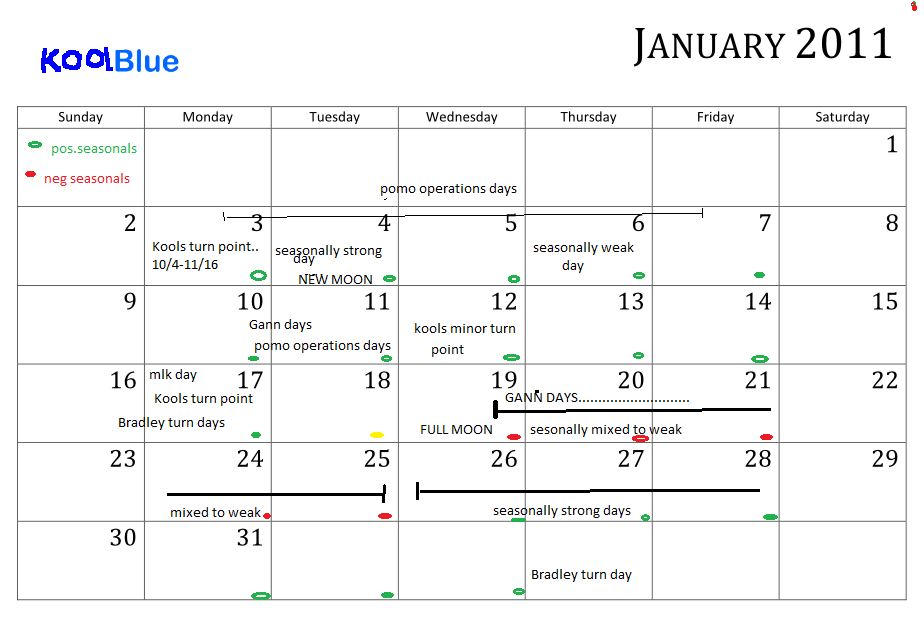
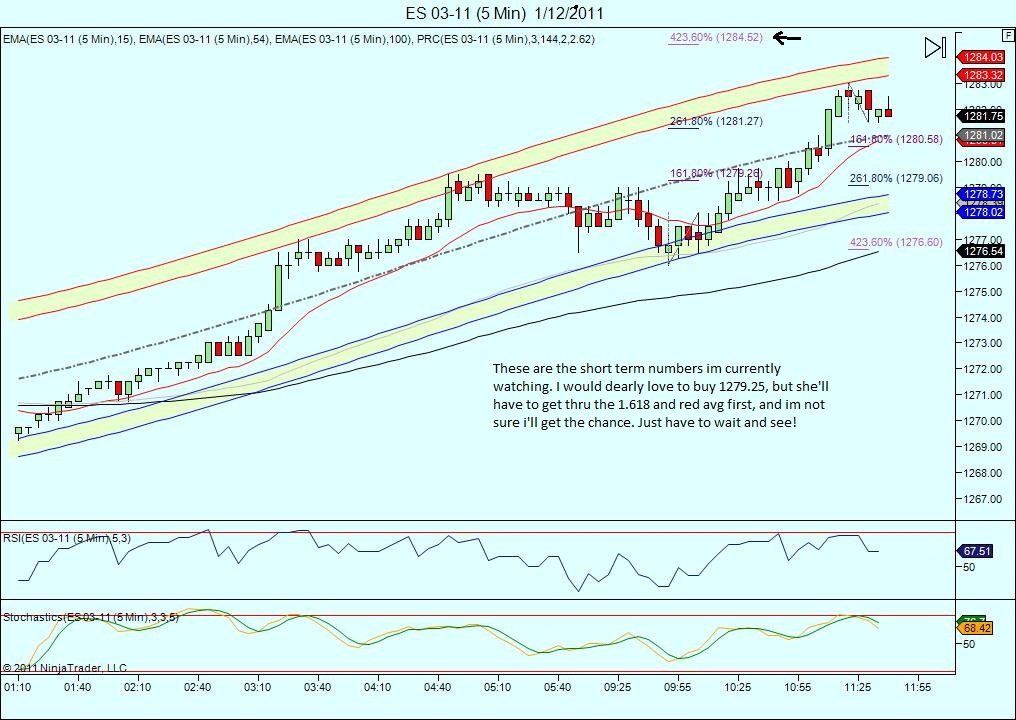
On my last weekend preview, i tried to point out the vulnerability of the market to a significant decline , but pointed out that sentiment, and seasonality pointed to a possible peak at higher prices and mid to late this month. I didnt post a preview this weekend because for me, nothing has changed. We appear to be getting closer in time and price to the expected end result. I,for one will be watching the time near the 17th with particular interest. For todays trading ,i will be watching the 1280.50, 1284.25 levels for possible shorts. Remember Portugals bond sale goes off around 10:30am , i believe. Fwiw, 1257.75 was my line in the sand, believe it or not ,and we've bounced off it twice this week and held it! I remain bullish untill price action tells me not too! The levels i showed on the weekend preview, remain areas of expectation for me. Here is my updated calendar...
Click image for original size
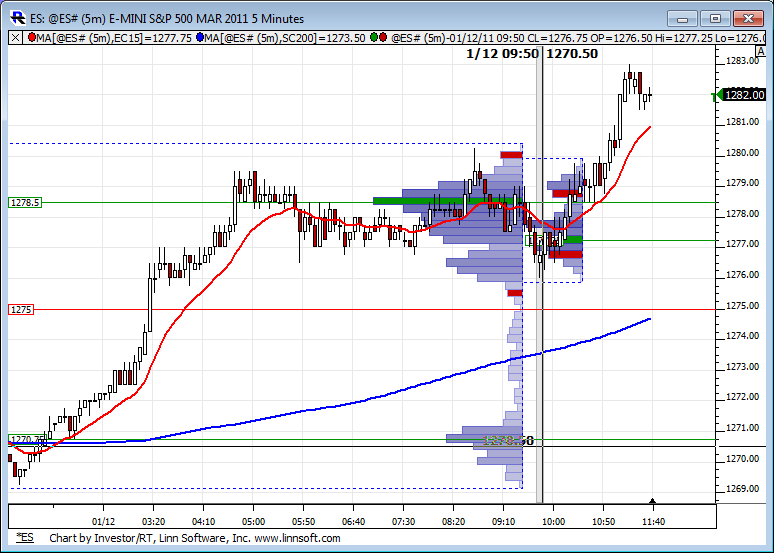
Sorry had trouble with snow this morning. Here is the O/N profile with the 1st hour RTH profile drawn next to it.
Click image for original size
Click image for original size
two sets of triples now below....81.50 is a rat !!! still risky...no half gap or trade back to R1...awesome!
air pocket below too
Yes Bruce, I noticed that since this morning, waiting to fill them
Originally posted by BruceM
air pocket below too
Stopped on my short at 1283.50, loss of 2.25 on one es...wishing for a decline to get long ,but....
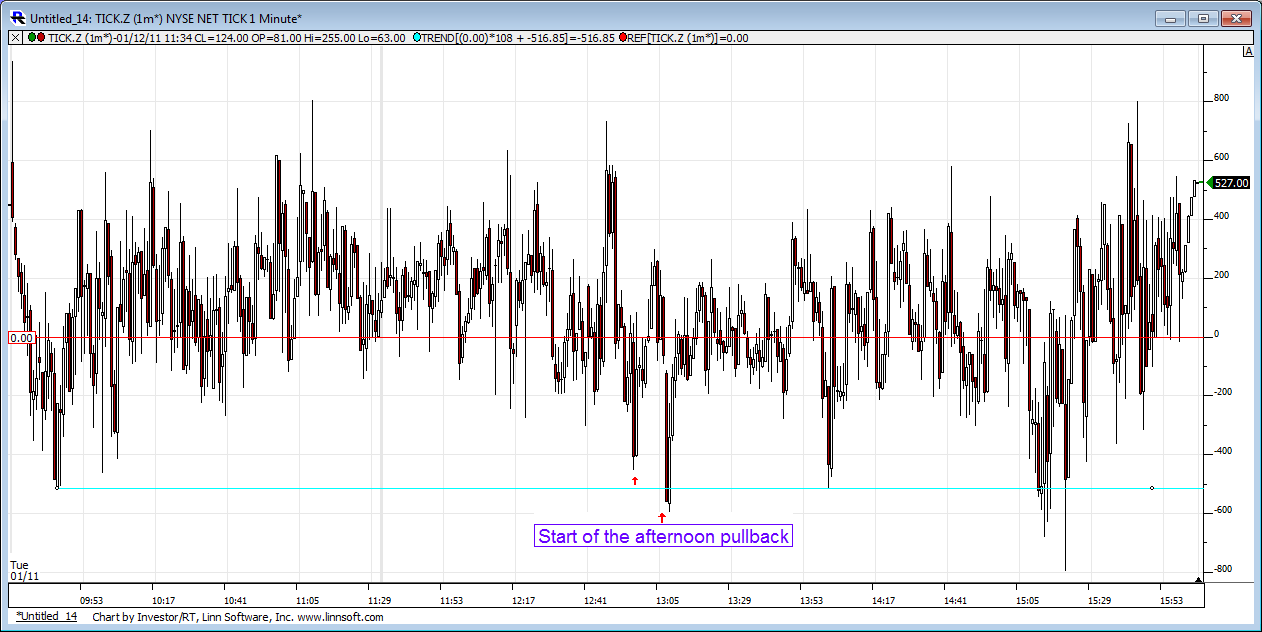
Here is what must change for shorts to work.....TICK!
well, after a few months of great upside action, i really believe bears will have their day, but probably not till next week and probably much closer to the 1301.50-1302.50 daily projections ,but time will tell. I think the last part of Jan will likely dissappoint the bulls!
As for the short term im inclined to happily buy 1279.00, and nervously sell 1284.50...lol
no test of previous 30 minute bars low yet today..so my bias has been short ...second try from 83.25 ...will explain later
Originally posted by BruceM
Are we missing a chart here ? Seems like something is lacking her eLorn!!Originally posted by Lorn
Here is what must change for shorts to work.....TICK!
No chart missing. But just for you here it is...
TICK shows an early morning low of -514 before the market rallies. The trend line from that low acted as a floor for equities and TICK never tested that again until close to 1:00pm.
You can see most of the day TICK spent its time above the zero line. This is equity buying and I'll make the case that the equity futures market follows the equity market, not the other way around.
A few sharp drops nearly touching -800 TICK between 2:00-2:30 but interestingly no 1-min close below that early trend line and prices found support as TICK rose back above the zero line and pretty much stayed above it into the close.
Click image for original size
Emini Day Trading /
Daily Notes /
Forecast /
Economic Events /
Search /
Terms and Conditions /
Disclaimer /
Books /
Online Books /
Site Map /
Contact /
Privacy Policy /
Links /
About /
Day Trading Forum /
Investment Calculators /
Pivot Point Calculator /
Market Profile Generator /
Fibonacci Calculator /
Mailing List /
Advertise Here /
Articles /
Financial Terms /
Brokers /
Software /
Holidays /
Stock Split Calendar /
Mortgage Calculator /
Donate
Copyright © 2004-2023, MyPivots. All rights reserved.
Copyright © 2004-2023, MyPivots. All rights reserved.