Weekend preview 1-15-11
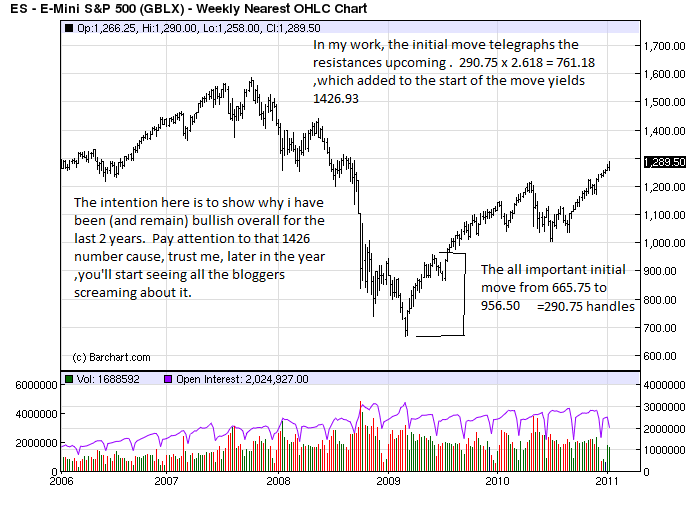
I really dont know how useful or interesting it is , but i'd like to start as usual with my 'big picture view' if nothing else, to explain why in the coming correction, i remain 'bullish ' overall. look, the market usually makes its yearly low early in the year ( early weakness, giving way to late strength= bullish ,remember?). The most likely time frame from seasonality and historical reasons are Feb -Mar or by Jun-July. The exact form of which is unknown of course. It could be a large mish-mash chewing up several weeks of time, or a steep decline of 80-100 handles. Imho, This time frame we are now entering, is ripe for the possiblility of an intermediate type decline to begin,at any time.
Click image for original size
heres a little closer daily look..
Click image for original size

The more interesting and useful shorter term view coming later today
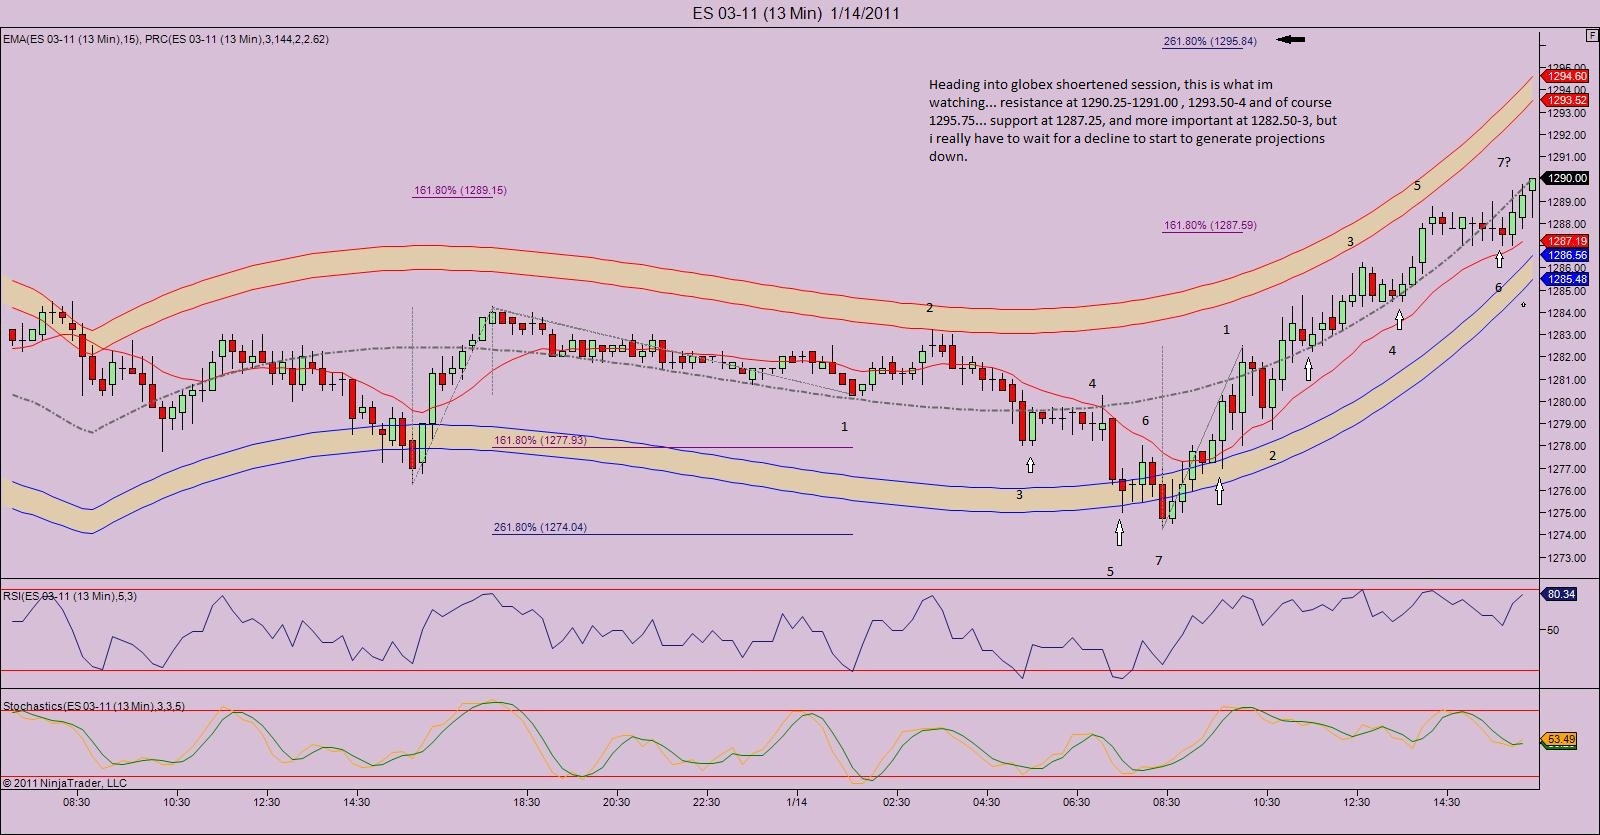
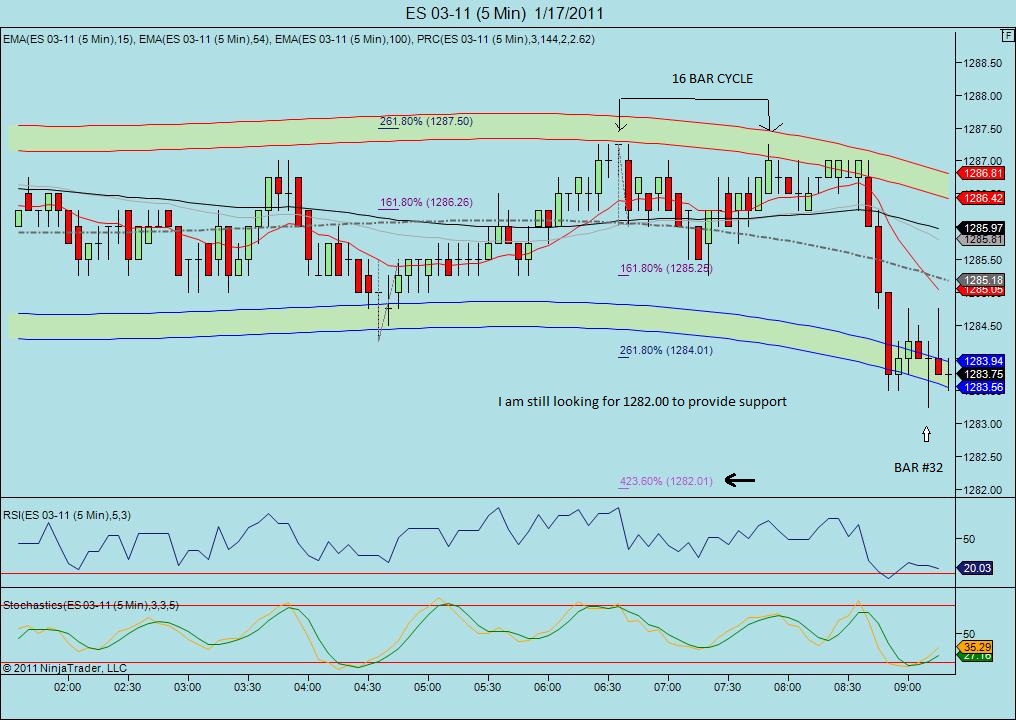
OK, Iv'e shown the bigger picture opinion,now what about the shorter term?... The trend is obviously up, tho we are now heading into a price area which starts just over 1300 where enough resistance MIGHT lie to initiate at the very least ,a short term decline. Here is a historical perspective(courtesy Cobra)of trading around MLK day (note Tues is +1)....
Click image for original size
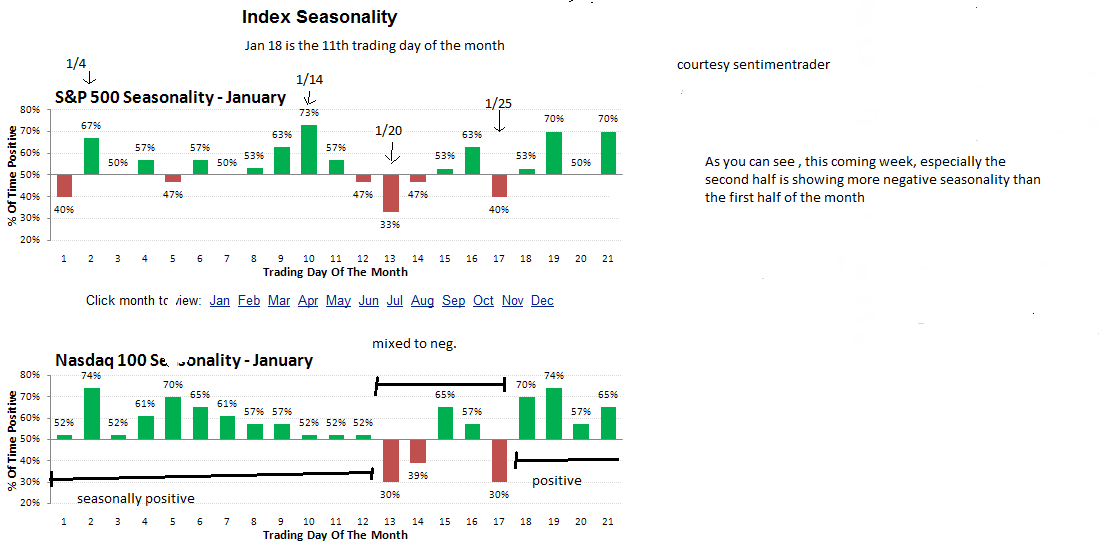
So in the past,at least, the week after MLK day was much more neg. than the week before. Seasonality would seem to agree with this view....
Click image for original size
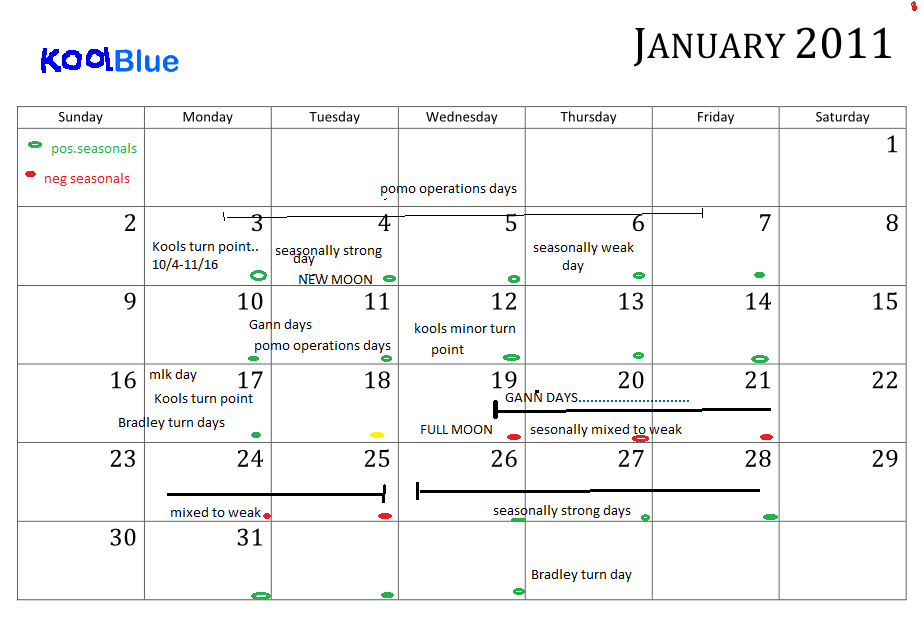
So were close to possible price resistance, historically and seasonally we could be near a time where a short term correction is 'normal' and we have Bradley and Kools tools signaling a possible turning point right around here!....
Click image for original size
Nov. was one of my best trading months ever, Dec was pretty good , and Jan started off awesome for me , but (mainly going against my own analysis) last week was actually a small losing week for me!.. At least now you'll understand if i begin more shorts than longs especially by thurs next week.
Now maybe im wrong and we start 'the' decline now or from the 4.236 of 1157.75to 1169.00=1305.50 or the next resistance point around 1313. I dont know, but the key to remember(for me anyway) is in a market that since the Nov low that has only seen little piddling declines, this is now entering the time and price areas where something more meaningful COULD occur! At least thats the way i see it! Good trading to all and keep all of your posts and ideas coming!
this post is extremely useful in my market prep for next week. thank you Kool for all the info... hope you have a great week trading this week!
Click image for original size
Click image for original size
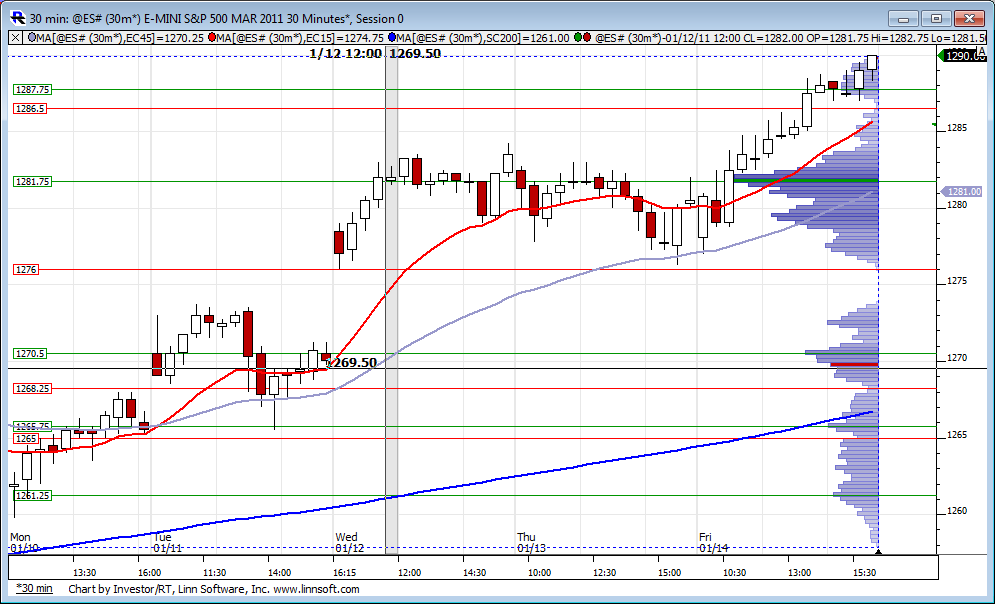
Here is last weeks profile with nodes marked green for HVN and red for LVN. We still have that gap open to 73.75. Will it be filled this week?
Click image for original size
Emini Day Trading /
Daily Notes /
Forecast /
Economic Events /
Search /
Terms and Conditions /
Disclaimer /
Books /
Online Books /
Site Map /
Contact /
Privacy Policy /
Links /
About /
Day Trading Forum /
Investment Calculators /
Pivot Point Calculator /
Market Profile Generator /
Fibonacci Calculator /
Mailing List /
Advertise Here /
Articles /
Financial Terms /
Brokers /
Software /
Holidays /
Stock Split Calendar /
Mortgage Calculator /
Donate
Copyright © 2004-2023, MyPivots. All rights reserved.
Copyright © 2004-2023, MyPivots. All rights reserved.