ES short term trading 1-19-11
Without question the key zone to watch is 90.50 - 92 that includes pivot numbers, the breakout from yesterday late in the day, MP numbers, the close clusters, O/N low and last weeks highs
above that is 96 - 98 area...yd highs and R1 area...
what I'm leaning towards is selling try and target all those left over triples from yesterday ultimately but making sure we start taking something off in front of that key zone....so basically sells above 92 ...will watch volume and $tick as usual
Originally posted by WSThere it's, ES moved down to test the prev. low 1281.25 and failed. 1278.50 is next support. Time for lunch. hmmm
Originally posted by WSES is trying to find support here near yesterday's low. I like for it to move down and test the recent low 1281.25, or at list move down near it. If finding support in this area I will go long over 1282.75 (yesterday's low) and the objective will be the PP.
Notice that ES is zig-zagging as usual at a important support area, as it is yesterday's low.
If the ES was to move above 1285,75, then the PvP will be the objective.
Below, the failure point for the test as support (zig-zags room to oscillate) will be 1279.75 and will target 1274/1275 area.
ES trading 1283.50 @ 10:58
The stp will be at 1280.75.
ES trading @ 1282.575 11:44
Will see, in due time the market will show me the way.
ES trading 1280.50 @ 12:34
Originally posted by optimusprimeOptimus, i use a wide variety of things to determine a bias for the day, but , bottom line i DONT know whether its going to be an up day or down day. I look at seasonals (currently negative) ,historical considerations LIKE ...# January Expiration Day, Down down 10 of last 12.
can someone please explain what prep you are doing before the open to determine the directions of the day or trade? i see fibs, murray math and TPO charts. how are these being tied together in order to find the direction of the market? you can answer after todays trading , i know this will take a while to respiond to. thank you
# January Expiration Week horrible since 1999, Dow down big 8 of last 11. (It is interesting to note that January’s option expiration week has been a down-week for the S&P 500 on the most recent 6 , on 8 out of the last 9 and 10 out of the last 12 occurrences.courtesy Frank Hogelucht).and for MLK week again , per Frank..Probabilities and odds for a higher / lower close one and two sessions later (Tuesday to Wednesday next week) are more or less evenly distributed, but are heavily tilt in favor of the downside at the end of Martin Luther King, Jr. Day week (day #4). The S&P 500 closed at a higher level at the end of the week on only 4.. Refer to the mlk chart posted by me on the weekend previews. iT SHOWS NEGATIVE INTO TOMORROW AT LEAST! (THIS IS DAY PLUS 2)And lastly, my own cycle work etc...Note that when i go against all of these,like today, i usually get crushed! LOL... HOPE THIS HELPS
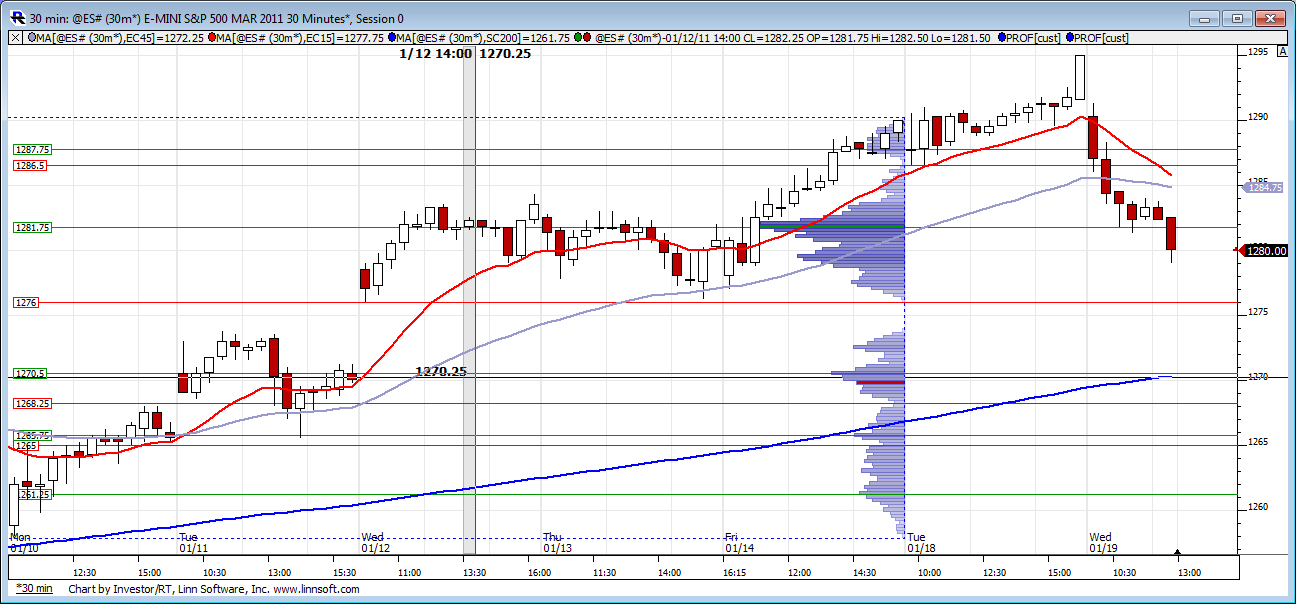
I think its useful to look at last weeks profile since prices have now penetrated last weeks highs.
Click image for original size
Here is something else to study...todays VWAP chart. Prices haven't been able to get above the 2 band (green)since RTH open. You can also see the volume profile on the right showing volume continuing to come in at these lower prices.
Click image for original size

ES found support at 1279.00 (Close to 1278.50) I'm long 1279.75. Stp 1278.50.
Objective 1287.75 and possibly the PP. 1290.75. Some resistance at 1282.50.
Overcoming 1282.50 will target the first objective.
Will see if works out. If it does, I think the objectives will be late in the session.
Stp is in place, will go for lunch now.........
ES trading 1280.50 @ 13:23
Objective 1287.75 and possibly the PP. 1290.75. Some resistance at 1282.50.
Overcoming 1282.50 will target the first objective.
Will see if works out. If it does, I think the objectives will be late in the session.
Stp is in place, will go for lunch now.........
ES trading 1280.50 @ 13:23
Originally posted by WS
Originally posted by WSThere it's, ES moved down to test the prev. low 1281.25 and failed. 1278.50 is next support. Time for lunch. hmmm
Originally posted by WSES is trying to find support here near yesterday's low. I like for it to move down and test the recent low 1281.25, or at list move down near it. If finding support in this area I will go long over 1282.75 (yesterday's low) and the objective will be the PP.
Notice that ES is zig-zagging as usual at a important support area, as it is yesterday's low.
If the ES was to move above 1285,75, then the PvP will be the objective.
Below, the failure point for the test as support (zig-zags room to oscillate) will be 1279.75 and will target 1274/1275 area.
ES trading 1283.50 @ 10:58
The stp will be at 1280.75.
ES trading @ 1282.575 11:44
Will see, in due time the market will show me the way.
ES trading 1280.50 @ 12:34
Forgot to mention that 1282.75 is right next to the resistance, so overcoming those two will be even better. Anyhow be back after lunch.....
Originally posted by WS
ES found support at 1279.00 (Close to 1278.50) I'm long 1279.75. Stp 1278.50.
Objective 1287.75 and possibly the PP. 1290.75. Some resistance at 1282.50.
Overcoming 1282.50 will target the first objective.
Will see if works out. If it does, I think the objectives will be late in the session.
Stp is in place, will go for lunch now.........
ES trading 1280.50 @ 13:23Originally posted by WS
Originally posted by WSThere it's, ES moved down to test the prev. low 1281.25 and failed. 1278.50 is next support. Time for lunch. hmmm
Originally posted by WSES is trying to find support here near yesterday's low. I like for it to move down and test the recent low 1281.25, or at list move down near it. If finding support in this area I will go long over 1282.75 (yesterday's low) and the objective will be the PP.
Notice that ES is zig-zagging as usual at a important support area, as it is yesterday's low.
If the ES was to move above 1285,75, then the PvP will be the objective.
Below, the failure point for the test as support (zig-zags room to oscillate) will be 1279.75 and will target 1274/1275 area.
ES trading 1283.50 @ 10:58
The stp will be at 1280.75.
ES trading @ 1282.575 11:44
Will see, in due time the market will show me the way.
ES trading 1280.50 @ 12:34
thank you Kool and lorn for your inputs and answering my questions. you guys are a huge help and i can't thank you enough.
Back from lunch and found out got stp out. Trying again here at a bounce from S2 1278.50. stp 1278.00. Same objectives as before.
Will see if works out.
ES trading 1279.75 @ 14:36
Will see if works out.
ES trading 1279.75 @ 14:36
Originally posted by WS
ES found support at 1279.00 (Close to 1278.50) I'm long 1279.75. Stp 1278.50.
Objective 1287.75 and possibly the PP. 1290.75. Some resistance at 1282.50.
Overcoming 1282.50 will target the first objective.
Will see if works out. If it does, I think the objectives will be late in the session.
Stp is in place, will go for lunch now.........
ES trading 1280.50 @ 13:23Originally posted by WS
Originally posted by WSThere it's, ES moved down to test the prev. low 1281.25 and failed. 1278.50 is next support. Time for lunch. hmmm
Originally posted by WSES is trying to find support here near yesterday's low. I like for it to move down and test the recent low 1281.25, or at list move down near it. If finding support in this area I will go long over 1282.75 (yesterday's low) and the objective will be the PP.
Notice that ES is zig-zagging as usual at a important support area, as it is yesterday's low.
If the ES was to move above 1285,75, then the PvP will be the objective.
Below, the failure point for the test as support (zig-zags room to oscillate) will be 1279.75 and will target 1274/1275 area.
ES trading 1283.50 @ 10:58
The stp will be at 1280.75.
ES trading @ 1282.575 11:44
Will see, in due time the market will show me the way.
ES trading 1280.50 @ 12:34
perfect hit on 78.50..the mypivots site has that as S2 today based on O/N data..FWIW
not the greatest sign that they haven't been able to get a close back inside the 60 minute low and recent tests up can't even trade to the 60 minute low...
It will be interesting to see when the market changes a bit and all declines aren't bought up right away...
and thanks Kool for posting the work over the weekend...you had the bearish case mapped out for us..
too late for me but I'm watching the 30 minute closes from Thursdday lows and more important is fridays Trend day open print at 77.50 area....then we have low volume from gap runs below there....
NQ is just now banging up against Yesterdays open..so faders will take a try long from here...
not me though...I'm watching my 4 year old sled from my window and need to get out there!!!
NQ is just now banging up against Yesterdays open..so faders will take a try long from here...
not me though...I'm watching my 4 year old sled from my window and need to get out there!!!
Originally posted by toaksiethey're called polynomial regression cycle bands. I'd be happy to send it to you but it only works on ninjatrader.
How do you get the arching bands on your charts kool?
Emini Day Trading /
Daily Notes /
Forecast /
Economic Events /
Search /
Terms and Conditions /
Disclaimer /
Books /
Online Books /
Site Map /
Contact /
Privacy Policy /
Links /
About /
Day Trading Forum /
Investment Calculators /
Pivot Point Calculator /
Market Profile Generator /
Fibonacci Calculator /
Mailing List /
Advertise Here /
Articles /
Financial Terms /
Brokers /
Software /
Holidays /
Stock Split Calendar /
Mortgage Calculator /
Donate
Copyright © 2004-2023, MyPivots. All rights reserved.
Copyright © 2004-2023, MyPivots. All rights reserved.